Code
print("This cell is intentionally left blank.") This notebook demonstrates how to run Pyro -Velocity in a Jupyter notebook on downsampled data. The results are not expected to be meaningful, but the notebook demonstrates the usage workflow with both a short execution time and using limited resources. It attempts to support both Google Colab and local or remote Jupyter kernel servers. Links to a blank copy of the notebook are provided below.
single-cell transcriptomics, probabilistic modeling, dynamical systems, RNA velocity
![]()
print("This cell is intentionally left blank.") print("This cell is intentionally left blank.") There are a number of cells in this notebook with
print("This cell is intentionally left blank.") These can be safely ignored or removed. They are exclusively used for compatibility with Google Colab's section folding logic.
Installation should take less than 10 minutes.
If you are running on a local or remote Jupyter server outside of Google Colab, we assume you have already installed pyrovelocity in the same environment in which the Jupyter kernel is running. If you have not, ensure you are in a virtual environment with python 3.11 active (we recommend pyenv or miniforge), and then you can install the development version from github with
pip install pyrovelocity[workflows] @ git+https://github.com/pinellolab/pyrovelocity.git@betaor a recent release from PyPI
pip install pyrovelocity[workflows]==0.2.0b12We also support installation from the anaconda conda-forge channel
mamba install \
  -c pytorch -c nvidia -c conda-forge \
  pytorch::pytorch conda-forge/label/pyrovelocity_dev::pyrovelocity
We do not use this option here because we find in Google Colab installation via anaconda takes about twice as long as from PyPI.
With respect to resource requirements, this notebook should be able to be run on any modern laptop. By default, the data are downsampled to 300 observations and training epochs truncated to 300 by setting the PYROVELOCITY_TESTING_FLAG to True. If you are running in Google Colab, then even in this testing mode, if you have access to High-RAM or T4 GPU runtimes this can significantly speed up library installation and execution. For a complete analysis with PYROVELOCITY_TESTING_FLAG disabled, at least High-RAM or T4 GPU runtimes are essentially required to execute in a reasonable amount of time. In this case, if you do not have a subscription to Google Colab Pro, running on a laptop should be sufficient for the data set we analyze here.
The following section involves checking if the notebook is running in colab, in which case it is certain that you will need to install or reinstall pyrovelocity. The simplest way to complete it is to run the Setup environment section, wait for the kernel to restart, and then run the same section again:
Setup environment section aboveYour session crashed for an unknown reason. View runtime logsSystemExit output in the Install pyrovelocity subsection belowSetup environment section (SystemExit / kernel restart will unfold it)Otherwise, the cells below can be executed manually. In either case, this section can be folded away after installation is complete.
If you need to edit the version number, please see the argument passed to install_package in the setup_pyrovelocity function below.
This first stage will download and install pyrovelocity. This usually takes less than 4 minutes. The runtime will then automatically restart. After this you can execute “Run all” to complete installation or proceed linearly below if you have added additional content you do not want to run all at once.
import importlib.util
import subprocess
import sys


def is_module_available(module_name: str):
    return importlib.util.find_spec(module_name) is not None


def install_package(package_name: str):
    """
    Install a package using pip. This is similar to cell magic
    `!pip install package_name`, but in python code for compatibility
    outside jupyter.

    Args:
        package_name (str): Name of the package to install.
    """
    process = subprocess.Popen(
        ["pip", "install", "-q", package_name],
        stdout=subprocess.PIPE,
        stderr=subprocess.PIPE,
        text=True,
    )
    for line in process.stdout:
        print(line, end="")
    for line in process.stderr:
        print(line, end="")
    process.wait()

def setup_pyrovelocity():
    if is_module_available("pyrovelocity"):
        try:
            import pyrovelocity
        except (ImportError, AssertionError):
            print("pyrovelocity is not successfully installed")
            sys.exit()
    else:
        print("Installing pyrovelocity...")
        install_package("pyrovelocity[workflows] @ git+https://github.com/pinellolab/pyrovelocity.git@beta")
        try:
            import pyrovelocity

            print(
                "\nThe kernel needs to restart in order to use pyrovelocity.\n"
                "Please run this cell again.\n"
            )
            sys.exit()
        except (ImportError, AssertionError):
            print("Failed to install pyrovelocity properly.")
sys.exit()import os
IN_COLAB = is_module_available("google.colab")
if IN_COLAB:
colab_release_tag = os.getenv("COLAB_RELEASE_TAG", None)
print(f"Google Colab release: {colab_release_tag}")
setup_pyrovelocity()
from google.colab import output
output.enable_custom_widget_manager()
else:
print("This notebook is probably not running in Google Colab")If installation was successful, the following commands should print the location of the __init__.py file for the pyrovelocity package and the currently installed version.
import pyrovelocity
if IN_COLAB:
  print(pyrovelocity.__file__)
print(pyrovelocity.__version__)0.2.1b1Please refer to the docs for tutorials and usage information.
In case there is an issue with pyrovelocity installation, the above output should be analogous to that shown below for the pyro package.
import pyro
if IN_COLAB:
  print(pyro.__file__)
print(pyro.__version__)
You can find links to pyrovelocity documentation and source code in the help below.
pyrovelocity.utils.internal_help(pyrovelocity) # ?pyrovelocity # to open in side panel tab for referenceHelp on package pyrovelocity:
NAME
pyrovelocity - Pyro-Velocity
DESCRIPTION
Pyro-Velocity is a python package for probabilistic modeling of RNA velocity.
docs: https://pyrovelocity.readthedocs.io
source: https://github.com/pinellolab/pyrovelocity
PyPI package: https://pypi.org/project/pyrovelocity
Conda package: https://anaconda.org/conda-forge/pyrovelocity
discussions: https://github.com/pinellolab/pyrovelocity/discussions
issues: https://github.com/pinellolab/pyrovelocity/issues
PACKAGE CONTENTS
__main__
analysis (package)
interfaces
io (package)
logging
metrics (package)
models (package)
plots (package)
styles (package)
tasks (package)
tests (package)
utils
workflows (package)
DATA
__all__ = ['analysis', 'io', 'logging', 'metrics', 'models', 'plots', ...
VERSION
0.2.1b1
In this section we demonstrate how to run a comprehensive analysis from accessing data to plotting results.
import os
os.environ["PYROVELOCITY_TESTING_FLAG"] = "True"
os.environ["PYROVELOCITY_LOG_LEVEL"] = "INFO"

import logging
logging.getLogger("jax").setLevel(logging.ERROR)
logging.getLogger("root").setLevel(logging.ERROR)
Before we start, we set a few environment variables to ensure our first execution occurs in a lightweight test mode with a subset of observations, variables, training epochs, and posterior samples. We also set a few log levels. Feel free to adjust these to ERROR, DEBUG, etc as needed.
After an initial review, we can set the PYROVELOCITY_TESTING_FLAG environment variable to False to run the full analysis.
The library supports execution via a sequence of workflow tasks. The approximate outline of these involves accessing external data, preprocessing, model training, postprocessing, and summarization.
We import these tasks and execute them in the subsections below.
import yaml

import pyrovelocity.utils
import pyrovelocity.workflows.main_workflow
from pyrovelocity.utils import print_config_tree
from pyrovelocity.utils import print_docstring
from pyrovelocity.workflows.main_workflow import download_data
from pyrovelocity.workflows.main_workflow import postprocess_data
from pyrovelocity.workflows.main_workflow import preprocess_data
from pyrovelocity.workflows.main_workflow import summarize_data
from pyrovelocity.workflows.main_workflow import train_modelIf you install the package in editable mode with pip install -e for development purposes, you may find it helpful to use
from importlib import reload

reload(pyrovelocity.utils)
reload(pyrovelocity.workflows.main_workflow)
We leave this out of this notebook since it is intended as a usage example.
To execute each task requires a single WorkflowConfiguration object, which is an instance of a python dataclass. In this notebook we illustrate execution with the standard pancreatic endocrinogenesis data set [1]. First we import the configuration dataclass
from pyrovelocity.workflows.main_configuration import pancreas_configurationWe can review the configuration dataclass by writing it to a yaml file or printing the dictionary representation to the console.
pancreas_configuration_dict = pancreas_configuration.to_dict()
print_config_tree(pancreas_configuration_dict, "pancreas configuration")

with open("pancreas_configuration.yaml", "w") as yaml_file:
    yaml.dump(pancreas_configuration_dict, yaml_file, sort_keys=False, default_flow_style=False, allow_unicode=True)
pancreas configuration └── download_dataset: data_external_path: data/external data_set_name: pancreas data_url: null n_obs: null n_vars: null source: pyrovelocity postprocess_configuration: number_posterior_samples: 4 postprocessing_resources_limits: cpu: '32' ephemeral_storage: 200Gi gpu: '0' mem: 120Gi postprocessing_resources_requests: cpu: '16' ephemeral_storage: 50Gi gpu: '0' mem: 60Gi preprocess_data: adata: data/external/pancreas.h5ad cell_state: clusters count_threshold: 0 data_processed_path: data/processed data_set_name: pancreas default_velocity_mode: dynamical min_shared_counts: 30 n_neighbors: 30 n_obs_subset: 300 n_pcs: 30 n_top_genes: 2000 n_vars_subset: 200 overwrite: false process_cytotrace: true use_obs_subset: true use_vars_subset: true vector_field_basis: umap summarizing_resources_limits: cpu: '16' ephemeral_storage: 200Gi gpu: '0' mem: 60Gi summarizing_resources_requests: cpu: '8' ephemeral_storage: 50Gi gpu: '0' mem: 30Gi training_configuration_1: adata: data/processed/pancreas_processed.h5ad batch_size: -1 cell_specific_kinetics: null data_set_name: pancreas force: false guide_type: auto_t0_constraint include_prior: true input_type: raw kinetics_num: 2 learning_rate: 0.01 library_size: true likelihood: Poisson log_every: 100 max_epochs: 300 model_identifier: model1 model_type: auto num_samples: 30 offset: false patient_improve: 0.0001 patient_init: 45 seed: 99 use_gpu: auto training_configuration_2: adata: data/processed/pancreas_processed.h5ad batch_size: -1 cell_specific_kinetics: null data_set_name: pancreas force: false guide_type: auto include_prior: true input_type: raw kinetics_num: 2 learning_rate: 0.01 library_size: true likelihood: Poisson log_every: 100 max_epochs: 300 model_identifier: model2 model_type: auto num_samples: 30 offset: true patient_improve: 0.0001 patient_init: 45 seed: 99 use_gpu: auto training_resources_limits: cpu: '16' ephemeral_storage: 200Gi gpu: '1' mem: 60Gi training_resources_requests: cpu: '8' ephemeral_storage: 50Gi gpu: '1' mem: 30Gi upload_results: false
Feel free to open the pancreas_configuration.yaml file to review the configuration settings. We will reprint the part of that configuration relevant to the execution of each task below. The resource requests and limits sections will be irrelevant for this example of local execution. The resource specifications are utilized during local or remote cluster-based execution of distributed containerized workflows.
To download data, we provide the download_data task function with the download_dataset attribute of the pancreas_configuration object.
print_config_tree(pancreas_configuration.download_dataset.to_dict(), "download dataset")download dataset └── data_external_path: data/external data_set_name: pancreas data_url: null n_obs: null n_vars: null source: pyrovelocity
This configuration primarily specifies the location to store the data and the data set name that is mapped to a source URL in the pyrovelocity.utils.datasets module. The other parameters can be used to specify a custom source URL or to filter the observations and variables to a subset of the full data set; however, since we are working with a natively supported data set we do not need to specify those here.
During local execution, all of the functions imported from the pyrovelocity.workflows.main_workflow module will cache their results. This means that if you run the same task function with the same arguments, it will not recompute the result, but just establish the presence of a cache hit. This is useful for avoiding redundant computation, but if you want to re-execute the function for testing, experimentation or other purposes. To avoid this, you can use the pyrovelocity.utils.clear_local_cache function to clear the cache. If you add the following block of code, the cache will be cleared whenever it is executed:
from pyrovelocity.utils import clear_local_cache

clear_local_cache()
You can also disable the cache setting the PYROVELOCITY_CACHE_FLAG environment variable to False. For example, you can add the following block of code to the notebook to disable the cache for all task functions:
import os
os.environ["PYROVELOCITY_CACHE_FLAG"] = "False"
For reference, during local execution, the cache is managed with a sqlite database by the diskcache library via flytekit.
data = download_data(download_dataset_args=pancreas_configuration.download_dataset)The preprocess data task is executed with the preprocess_data function. The preprocess_data function takes the FlyteFile object, here named data above, from download_data task function and the preprocess_data attribute of the pancreas_configuration object as arguments.
print_config_tree(pancreas_configuration.preprocess_data.to_dict(), "preprocess data")preprocess data └── adata: data/external/pancreas.h5ad cell_state: clusters count_threshold: 0 data_processed_path: data/processed data_set_name: pancreas default_velocity_mode: dynamical min_shared_counts: 30 n_neighbors: 30 n_obs_subset: 300 n_pcs: 30 n_top_genes: 2000 n_vars_subset: 200 overwrite: false process_cytotrace: true use_obs_subset: true use_vars_subset: true vector_field_basis: umap
The components of the preprocess data configuration are determined by the components of the pyrovelocity.preprocess.preprocess_dataset function whose documentation can be accessed via help or ? in the notebook
print_docstring(pyrovelocity.tasks.preprocess.preprocess_dataset)Preprocess data. Args: data_set_name (str): name of data set. adata (AnnData, optional): AnnData object containing the data set to preprocess. data_processed_path (str | Path, optional): path to processed data. Defaults to "data/processed". overwrite (bool, optional): overwrite existing processed data. Defaults to False. n_top_genes (int, optional): number of genes to retain. Defaults to 2000. min_shared_counts (int, optional): minimum shared counts. Defaults to 30. process_cytotrace (bool, optional): process data with cytotrace. Defaults to False. use_obs_subset (bool, optional): use observation subset. Defaults to False. n_obs_subset (int, optional): number of observations to subset. Defaults to 300. use_vars_subset (bool, optional): use variable subset. Defaults to False. n_vars_subset (int, optional): number of variables to subset. Defaults to 200. count_threshold (int, optional): count threshold. Defaults to 0. n_pcs (int, optional): number of principal components. Defaults to 30. n_neighbors (int, optional): number of neighbors. Defaults to 30. default_velocity_mode (str, optional): default velocity mode. Defaults to "dynamical". vector_field_basis (str, optional): vector field basis. Defaults to "umap". cell_state (str, optional): Name of the cell state/cluster variable. Defaults to "clusters". Returns: AnnData: processed AnnData object Examples: >>> from pyrovelocity.data import download_dataset # xdoctest: +SKIP >>> tmp = getfixture('tmp_path') # xdoctest: +SKIP >>> simulated_dataset_path = download_dataset( ... 'simulated', ... str(tmp) + '/data/external', ... 'simulate', ... n_obs=100, ... n_vars=300, ... ) # xdoctest: +SKIP >>> preprocess_dataset( ... data_set_name="simulated", ... adata=simulated_dataset_path, ... ) # xdoctest: +SKIP
Recall that the output of the preprocess_data function below will be cached and should rerun almost instantaneously if you re-execute the cell multiple times.
processed_data = preprocess_data(
  data=data,
  preprocess_data_args=pancreas_configuration.preprocess_data,
)
Flyte preprocess input data path: /var/folders/gm/sczlkg_x4kd39019wn_f7hy80000gn/T/flyte-0fiovuo5/raw/be77049e1a6f7f5a014855d8db50ecd5/pancreas.h5ad
[17:58:45] INFO     pyrovelocity.tasks.data Reading input file:
                    /var/folders/gm/sczlkg_x4kd39019wn_f7hy80000gn/T/flyte-0fiovuo5/raw/be77049e1a6f7f5a014855d8db5
                    0ecd5/pancreas.h5ad
[17:58:46] INFO pyrovelocity.tasks.preprocess extracting 300 observation subset from 3696 observations
           INFO     pyrovelocity.tasks.preprocess

                    Verifying existence of path for:

                      processed data: data/processed
           INFO     pyrovelocity.tasks.preprocess

                    Preprocessing pancreas data :

                      from:
                    /var/folders/gm/sczlkg_x4kd39019wn_f7hy80000gn/T/flyte-0fiovuo5/raw/be77049e1a6f7f5a014855d8db5
                    0ecd5/pancreas.h5ad
                      to processed: data/processed/pancreas_processed.h5ad
           INFO     pyrovelocity.utils
                    AnnData object with n_obs × n_vars = 300 × 27998
                        obs:
                            clusters_coarse,
                            clusters,
                            S_score,
                            G2M_score,
                        var:
                            highly_variable_genes,
                        uns:
                            clusters_coarse_colors,
                            clusters_colors,
                            day_colors,
                            neighbors,
                            pca,
                        obsm:
                            X_pca,
                            X_umap,
                        layers:
                            spliced,
                            unspliced,
                        obsp:
                            distances,
                            connectivities,
INFO pyrovelocity.tasks.preprocess data/processed/pancreas_processed.h5ad exists
Flyte preprocess output data path: data/processed/pancreas_processed.h5ad
The train model task is executed with the train_model function. The train_model task function takes the FlyteFile object, here named processed_data above, from preprocess_data task function and one of the PyrovelocityTrainInterface objects such as is found in the training_configuration_1 attribute of the pancreas_configuration object as arguments.
The configuration is given by
print_config_tree(pancreas_configuration.training_configuration_1.to_dict(), "train model 1")train model 1 └── adata: data/processed/pancreas_processed.h5ad batch_size: -1 cell_specific_kinetics: null data_set_name: pancreas force: false guide_type: auto_t0_constraint include_prior: true input_type: raw kinetics_num: 2 learning_rate: 0.01 library_size: true likelihood: Poisson log_every: 100 max_epochs: 300 model_identifier: model1 model_type: auto num_samples: 30 offset: false patient_improve: 0.0001 patient_init: 45 seed: 99 use_gpu: auto
The PyrovelocityTrainInterface is a configuration for the pyrovelocity.tasks.train.train_dataset function whose documentation we print below.
print_docstring(pyrovelocity.tasks.train.train_dataset)Loads processed data, trains model, and saves model and posterior samples. Inputs: data/processed/{data_set_name}_processed.h5ad Outputs: models/{data_model}/ ├── trained.h5ad ├── posterior_samples.pkl.zst └── model/ ├── attr.pkl ├── model_params.pt ├── param_store_test.pt └── var_names.csv The file `models/{data_model}/pyrovelocity.pkl` used in `pyrovelocity.tasks.summarize.summarize_dataset` is produced by `pyrovelocity.tasks.postprocess.postprocess_dataset`. Args: adata (str | AnnData): Path to a file that can be read to an AnnData object or an AnnData object. data_set_name (str, optional): Name of the dataset. Default is "simulated". model_identifier (str, optional): Identifier for the model. Default is "model2". guide_type (str, optional): The type of guide function for the Pyro model. Default is "auto". model_type (str, optional): The type of Pyro model. Default is "auto". batch_size (int, optional): Batch size for training. Default is -1, which indicates using the full dataset. use_gpu (int, optional): Whether to use GPU for training. Default is 0, which indicates not using GPU. likelihood (str, optional): Likelihood function for the Pyro model. Default is "Poisson". num_samples (int, optional): Number of posterior samples. Default is 30. log_every (int, optional): Frequency of logging progress. Default is 100. patient_improve (float, optional): Minimum improvement in training loss for early stopping. Default is 5e-4. patient_init (int, optional): Number of initial training epochs before early stopping is enabled. Default is 30. seed (int, optional): Random seed for reproducibility. Default is 99. learning_rate (float, optional): Learning rate for the optimizer. Default is 0.01. max_epochs (int, optional): Maximum number of training epochs. Default is 3000. include_prior (bool, optional): Whether to include prior information in the model. Default is True. library_size (bool, optional): Whether to correct for library size. Default is True. offset (bool, optional): Whether to add an offset to the model. Default is False. input_type (str, optional): Type of input data. Default is "raw". cell_specific_kinetics (Optional[str], optional): Name of the attribute containing cell-specific kinetics information. Default is None. kinetics_num (int, optional): Number of kinetics parameters. Default is 2. force (bool, optional): Whether to overwrite existing files. Default is False. Returns: Tuple[str, str, Path, Path, Path, Path, Path, Path]: Tuple containing the name of the data model, the path to the model directory, the path to the trained data, the path to the model, the path to the posterior samples, the path to the metrics, the path to the run info, and the path to the loss plot. Examples: >>> train_dataset() # xdoctest: +SKIP
Finally, we execute the train_model task function
model_output = train_model(
  processed_data=processed_data,
  train_model_configuration=pancreas_configuration.training_configuration_1,
)
Flyte train model input data path: /var/folders/gm/sczlkg_x4kd39019wn_f7hy80000gn/T/flyte-0fiovuo5/raw/327097e0a301e42c089e0124bfcfc8c6/pancreas_processed.h5ad
           INFO     pyrovelocity.tasks.train

                    Training: pancreas_model1
           INFO     pyrovelocity.tasks.train

                    Verifying existence of paths for:

                      model data: models/pancreas_model1
           INFO     pyrovelocity.tasks.train Accelerator type specified as auto resolves to:
                            accelerator: cpu
                            devices: 1
                            device: cpu
           INFO     pyrovelocity.tasks.train
                    models/pancreas_model1/trained.h5ad
                    models/pancreas_model1/model
                    models/pancreas_model1/posterior_samples.pkl.zst
                    all exist, set `force=True` to overwrite.
Flyte train model outputs:
    data model: pancreas_model1
    data model path: models/pancreas_model1
    trained data path: models/pancreas_model1/trained.h5ad
    model path: models/pancreas_model1/model
    posterior samples path: models/pancreas_model1/posterior_samples.pkl.zst
    metrics path: models/pancreas_model1/metrics.json
    run info path: models/pancreas_model1/run_info.json
    loss plot path: models/pancreas_model1/ELBO.png
This produces the model_output object, which is an instance of the TrainingOutputs dataclass.
print_config_tree(model_output.to_dict(), "model output")model output └── data_model: pancreas_model1 data_model_path: models/pancreas_model1 loss_plot_path: path: /var/folders/gm/sczlkg_x4kd39019wn_f7hy80000gn/T/flyte-0fiovuo5/raw/232096698f70b181c09e2a34e4a8112f/ELBO.png metrics_path: path: /var/folders/gm/sczlkg_x4kd39019wn_f7hy80000gn/T/flyte-0fiovuo5/raw/b4aa896d78ca287524d46291049741cf/metrics.json model_path: path: models/pancreas_model1/model posterior_samples_path: path: /var/folders/gm/sczlkg_x4kd39019wn_f7hy80000gn/T/flyte-0fiovuo5/raw/fee73d174139507f0c2a6ad359ec2cd9/posterior_samples.pkl.zst run_info_path: path: /var/folders/gm/sczlkg_x4kd39019wn_f7hy80000gn/T/flyte-0fiovuo5/raw/b2f48016dc7ae13eb54f5b29f4686d79/run_info.json trained_data_path: path: /var/folders/gm/sczlkg_x4kd39019wn_f7hy80000gn/T/flyte-0fiovuo5/raw/b9e9f71144a612490cb4dd7869139877/trained.h5ad
Due to caching, the paths to the model outputs will involve temporary folders, but the relevant outputs are also available in the models folder next to the notebook.
The postprocess data task is executed with the postprocess_data function. The postprocess_data function takes the preprocess data configuration, the training outputs, here named model_output above, from the train_model task function and the postprocess_configuration attribute of the pancreas_configuration object as arguments.
print_config_tree(pancreas_configuration.postprocess_configuration.to_dict(), "postprocess data")postprocess data └── number_posterior_samples: 4
The configuration required to postprocess the data are determined by the components of the pyrovelocity.tasks.postprocess.postprocess_dataset function interface whose documentation can be accessed via help or ? in the notebook
print_docstring(pyrovelocity.tasks.postprocess.postprocess_dataset)Postprocess dataset computing vector field uncertainty for a given set of posterior samples. Args: data_model (str): string containing the data set and model identifier, e.g. simulated_model1 data_model_path (str | Path): top level directory for this data-model pair, e.g. models/simulated_model1 trained_data_path (str | Path): path to the trained data, e.g. models/simulated_model1/trained.h5ad model_path (str | Path): path to the model, e.g. models/simulated_model1/model posterior_samples_path (str | Path): path to the posterior samples, e.g. models/simulated_model1/posterior_samp metrics_path (str | Path): path to the metrics, e.g. models/simulated_model1/metrics.json vector_field_basis (str): basis for the vector field, e.g. umap Returns: str: path to the pyrovelocity output data Examples: >>> from pyrovelocity.tasks.postprocess import postprocess_dataset # xdoctest: +SKIP >>> tmp = getfixture("tmp_path") # xdoctest: +SKIP >>> postprocess_dataset( ... "simulated_model1", ... "models/simulated_model1", ... "models/simulated_model1/trained.h5ad", ... "models/simulated_model1/model", ... "models/simulated_model1/posterior_samples.pkl.zst", ... "models/simulated_model1/metrics.json", ... "leiden", ... 3, ... ) # xdoctest: +SKIP
We execute the postprocess_data task function with the inputs described above.
You can safely remove and dedent code executed in the context of SuppressOutput in a notebook execution environment.
The SuppressOutput context manager is used to suppress some of the output of the function calls placed in its context. This is purely used as a work-around for compatibility with multiple output formats such as html and pdf and it will be removed in the future. It is not necessary for the execution of the postprocess_data function in general or for execution in a notebook in particular.
from pyrovelocity.utils import SuppressOutput

with SuppressOutput():
  postprocessing_outputs = postprocess_data(
    preprocess_data_args=pancreas_configuration.preprocess_data,
    training_outputs=model_output,
    postprocess_configuration=pancreas_configuration.postprocess_configuration,
)Now we have what is required to construct a summary of the results. The summarize_data task function takes the preprocessing configuration, postprocessing_outputs object and the model_outputs and generates a suite of plots summarizing the results.
dataset_summary = summarize_data(
  preprocess_data_args=pancreas_configuration.preprocess_data,
  postprocessing_outputs=postprocessing_outputs,
  training_outputs=model_output,
)The call to summarize_data generates a large number of plots which are saved to the dataset_summary.data_model_reports.path. This currently resolves to a subfolder of ./reports. The name of the subfolder joins the data set name with the name of the model type. We capture the plot outputs to prevent them from generating a very long cell output. We review several of the plots in Section 3.1. The remaining plots are available in the dataset_summary.data_model_reports.path folder. If you cannot locate it in the file browser, you can execute
print(dataset_summary.data_model_reports.path)after the cell containing the call to summarize_data completes to verify the path where the plots are located.
The dataset summary contains
print_config_tree(dataset_summary.to_dict(), "dataset summary")dataset summary └── data_model_reports: path: reports/pancreas_model1 dataframe: path: /var/folders/gm/sczlkg_x4kd39019wn_f7hy80000gn/T/flyte-0fiovuo5/raw/9c76644216c1d6123aae21b72b0e68a0/pancreas_model1_dataframe.pkl.zst
from IPython.display import Image, displayThe maximum values of the unspliced and spliced count data for each gene across cells is shown in Figure 1.
display(Image(filename=f"data/processed/pancreas_thresh_histogram.pdf.png"))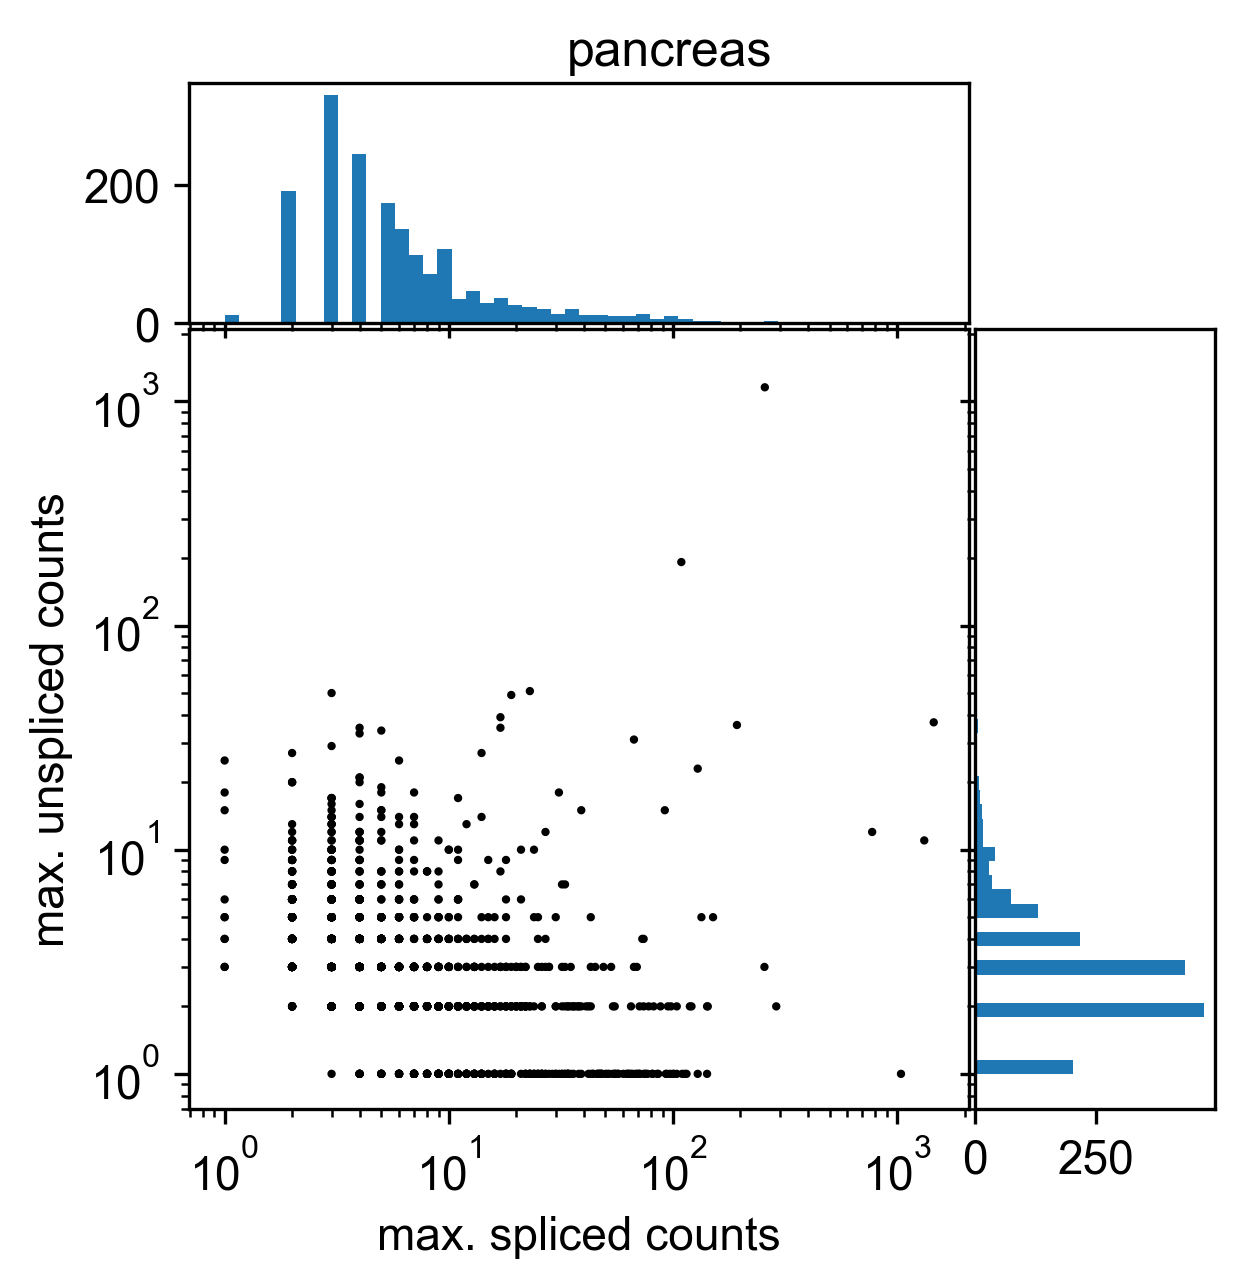
A vector field estimate of cell state transformation probability derived from RNA velocity estimates with cluster annotations is shown in Figure 2.
display(Image(filename=f"{dataset_summary.data_model_reports.path}/vector_field.pdf.png"))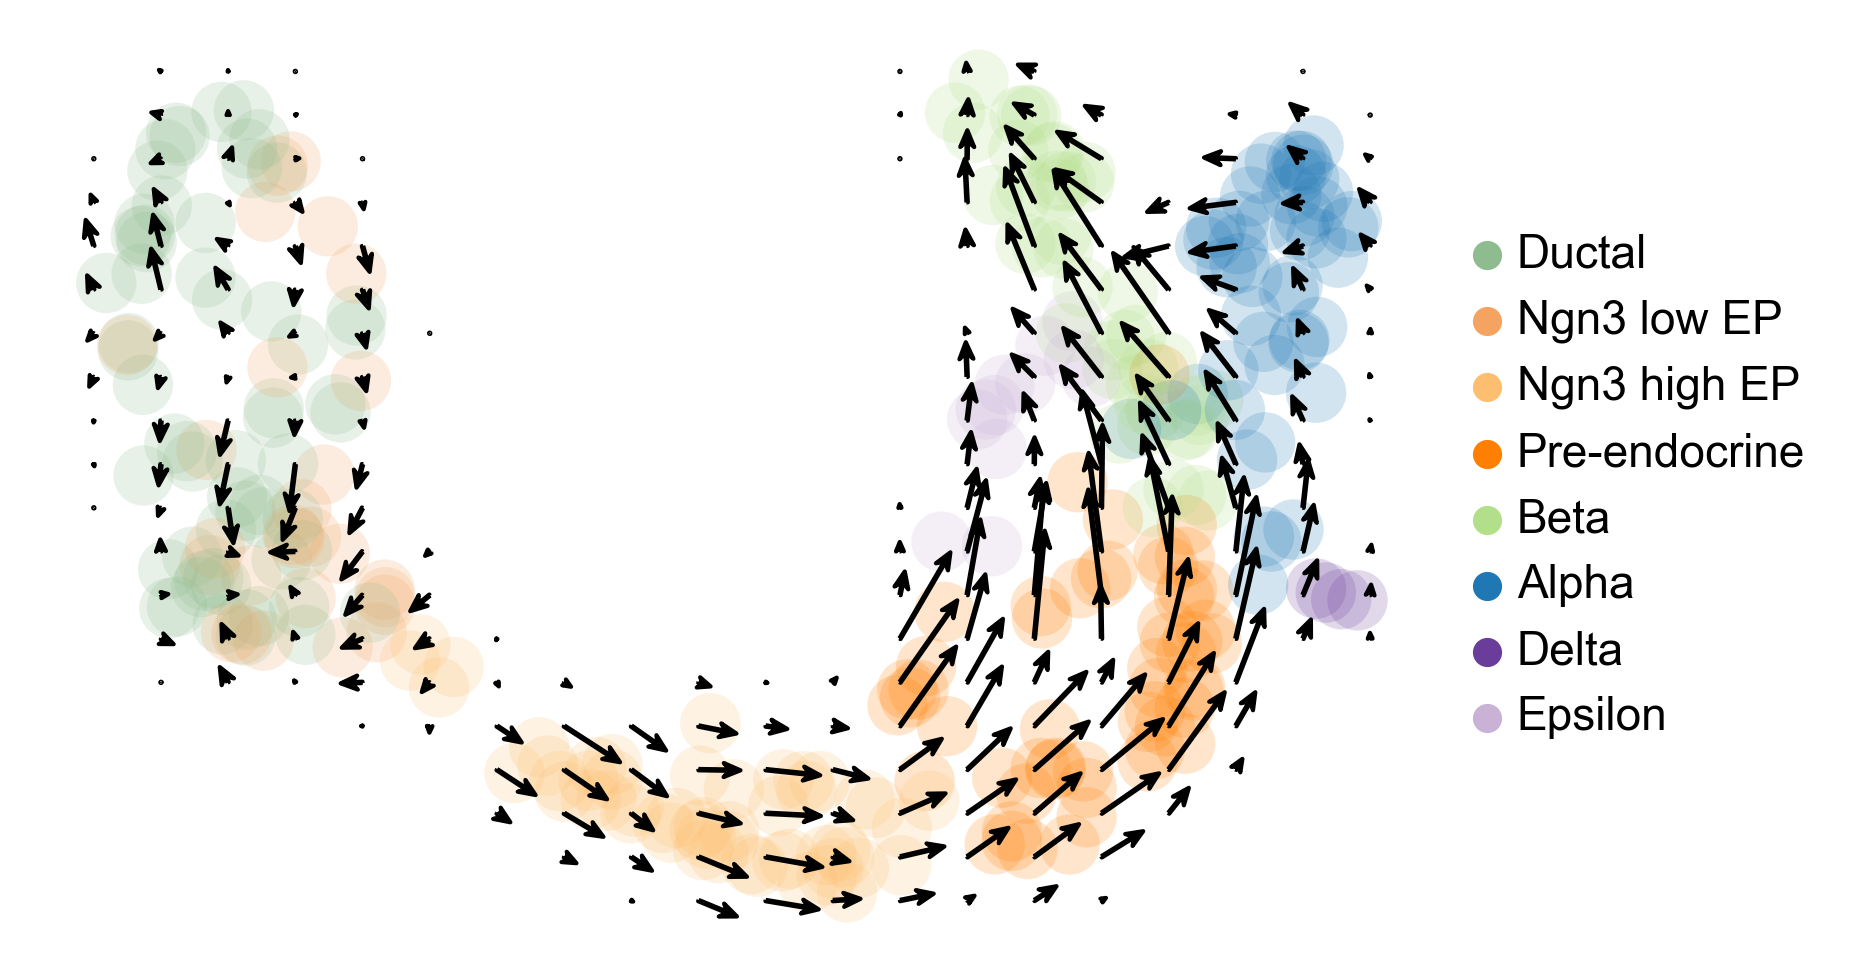
Figure 3 shows a low-dimensional representation of the RNA velocity vector fields with uncertainty estimates for shared time and angle. The latter quantity is estimated in PCA space. The base magnitude uncertainty is also shown but may not be interpretable.
display(Image(filename=f"{dataset_summary.data_model_reports.path}/vector_field_summary_plot.pdf.png"))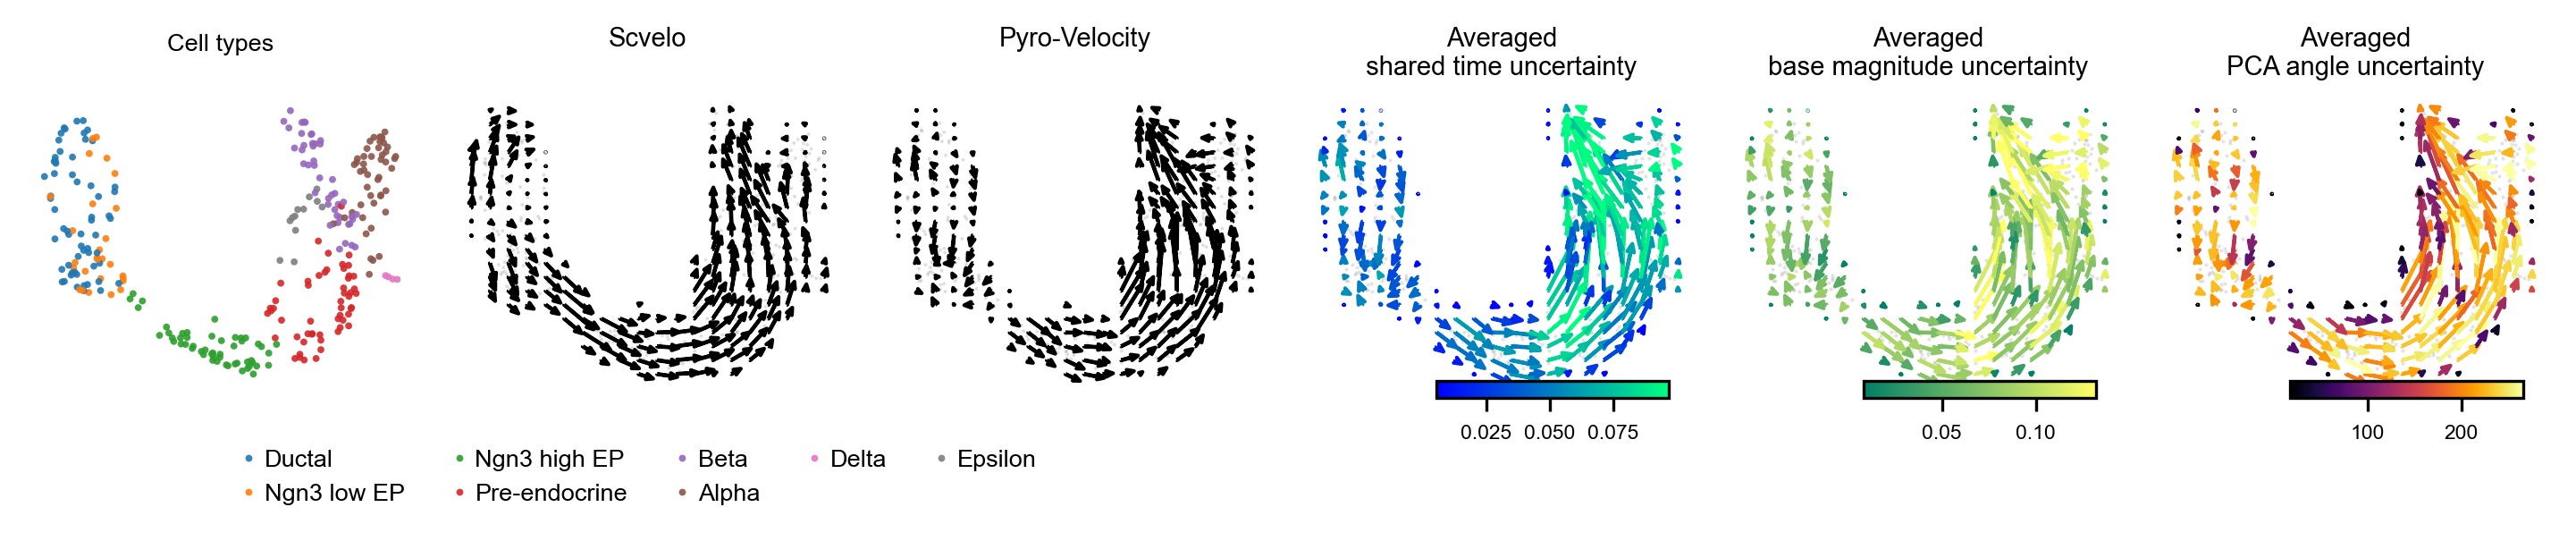
A volcano plot adapted for probabilistic inference of RNA velocity is shown in Figure 4. This plot shows the mean absolute error versus shared time correlation for each gene.
display(Image(filename=f"{dataset_summary.data_model_reports.path}/volcano.pdf.png"))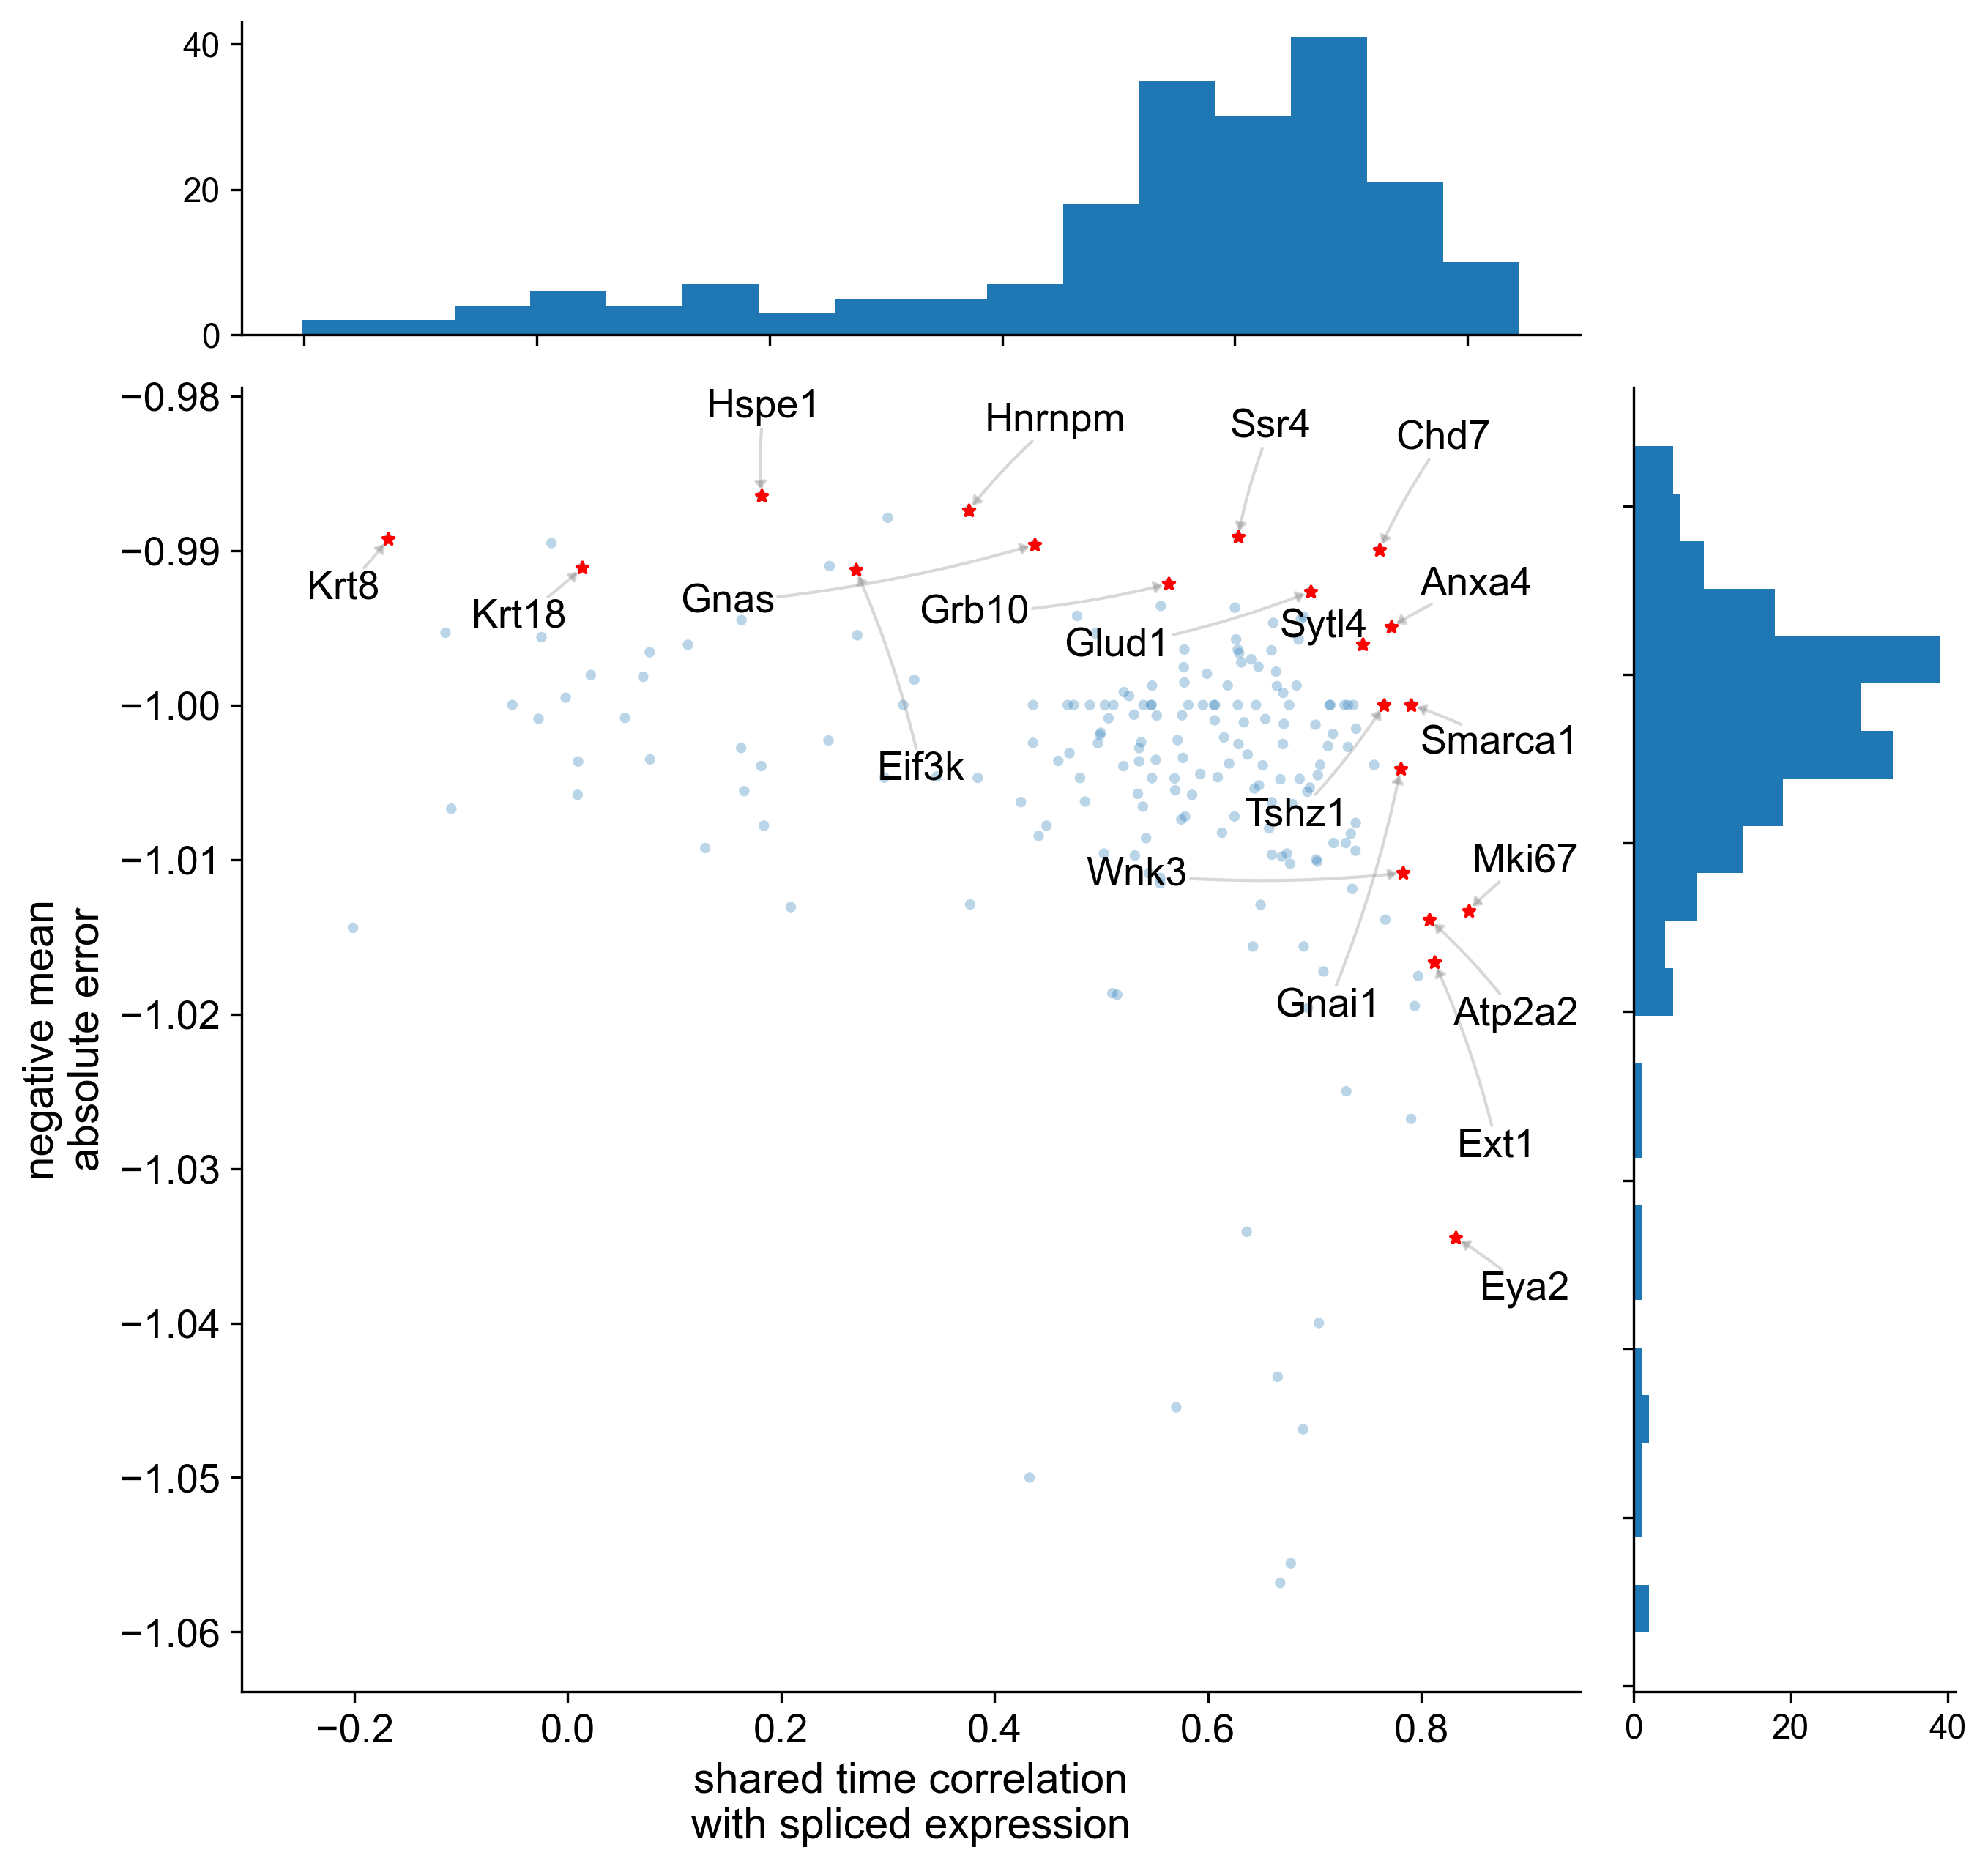
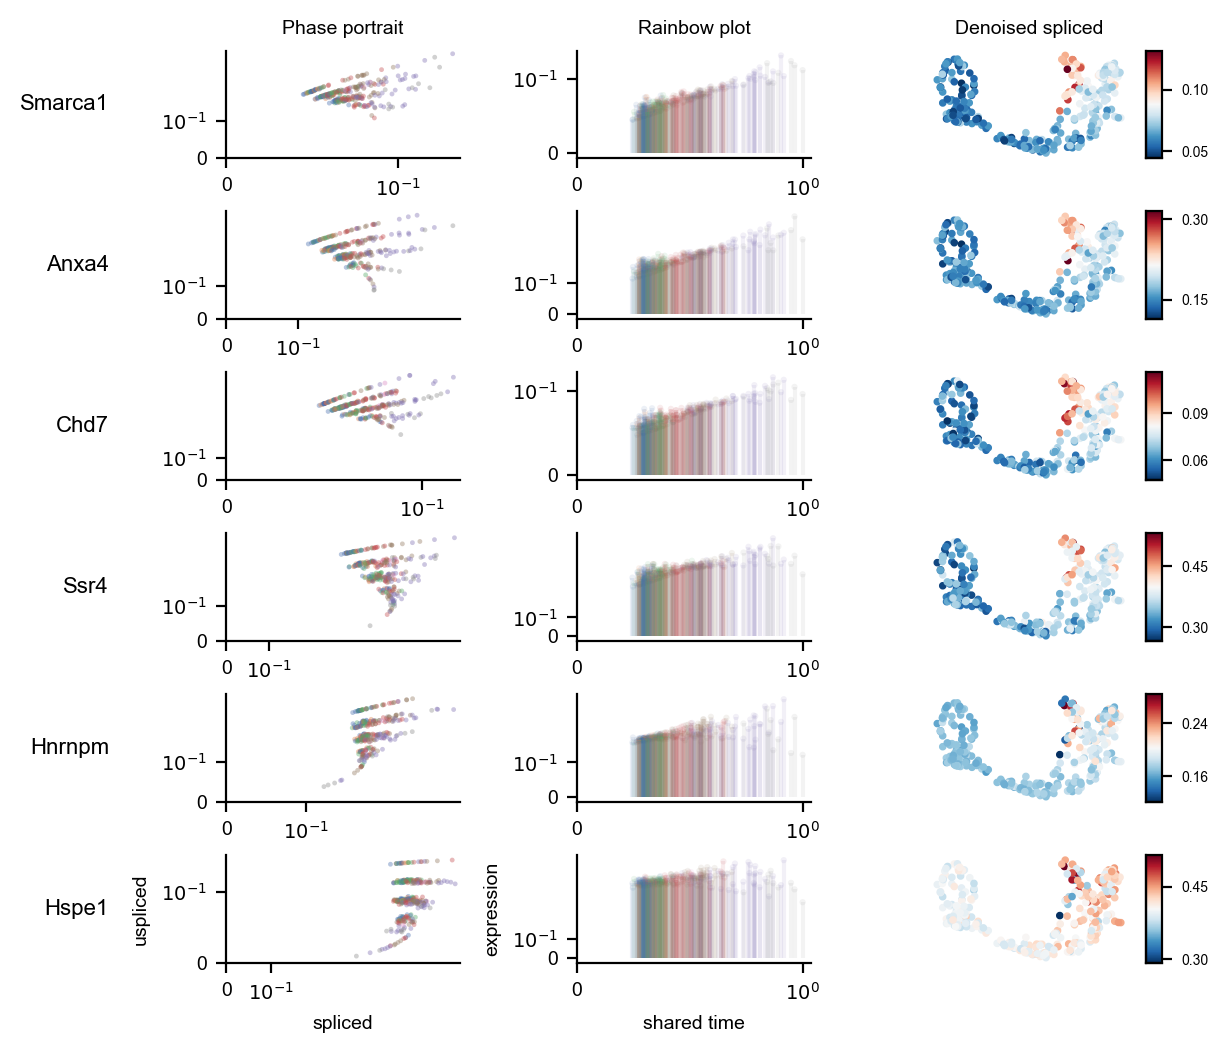
Figure 5 shows the splice state phase portraits, estimated expression levels over shared time, and shared time correlation for a subset of selected genes.
display(Image(filename=f"{dataset_summary.data_model_reports.path}/gene_selection_rainbow_plot.pdf.png"))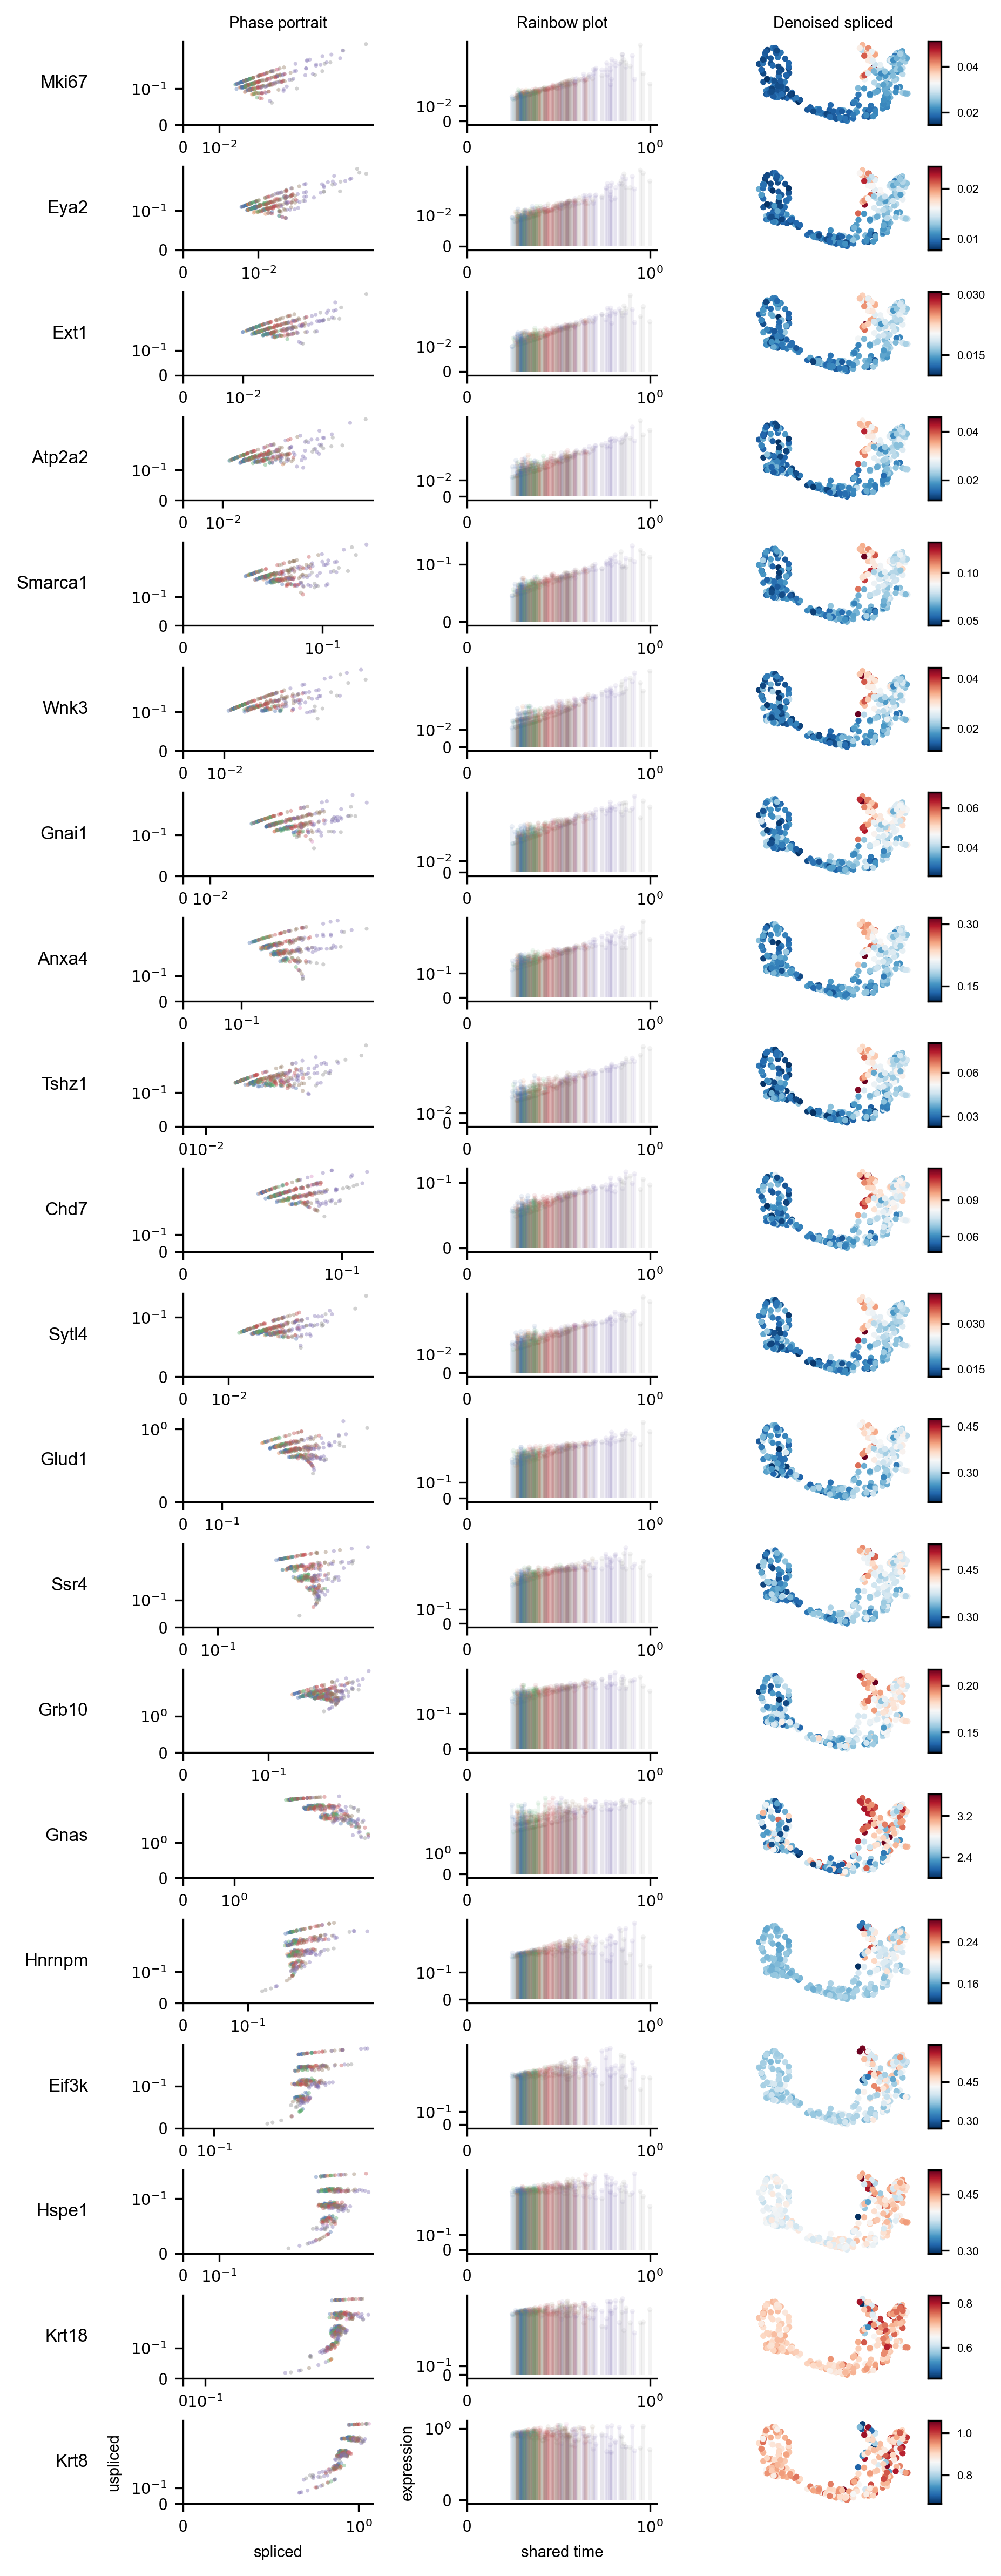
A summary of the gene selection results is shown in Figure 6.
display(Image(filename=f"{dataset_summary.data_model_reports.path}/gene_selection_summary_plot.pdf.png"))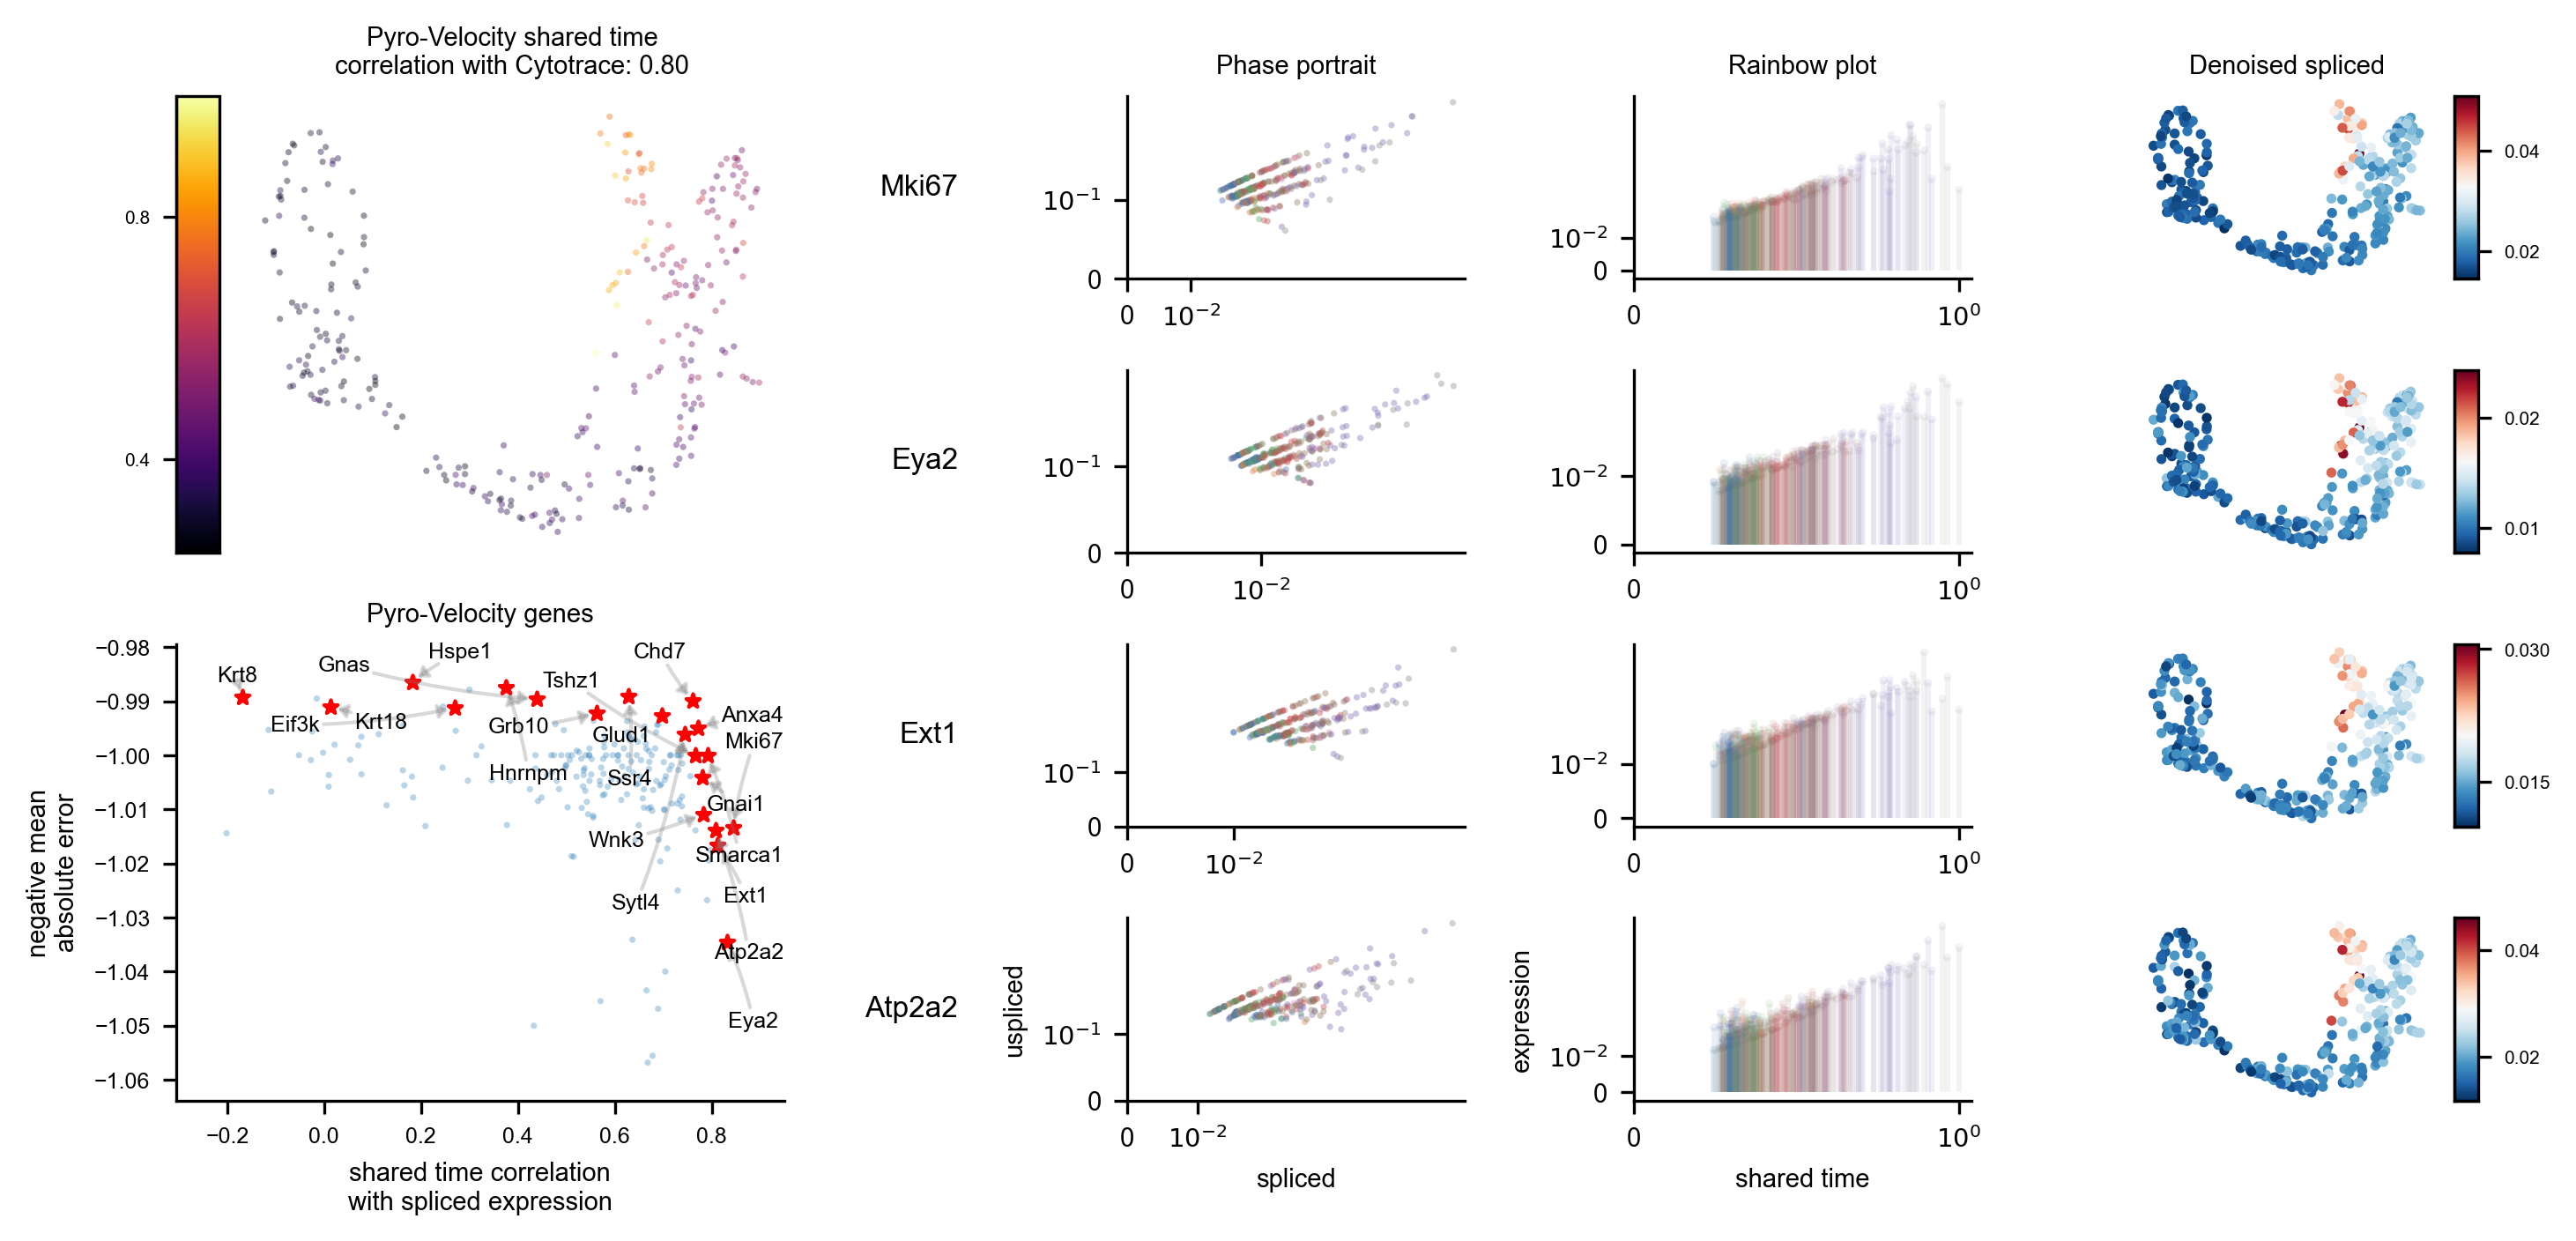
Estimates for parameter uncertainties for a subset of genes are shown in Figure 7.
display(Image(filename=f"{dataset_summary.data_model_reports.path}/parameter_uncertainties.pdf.png"))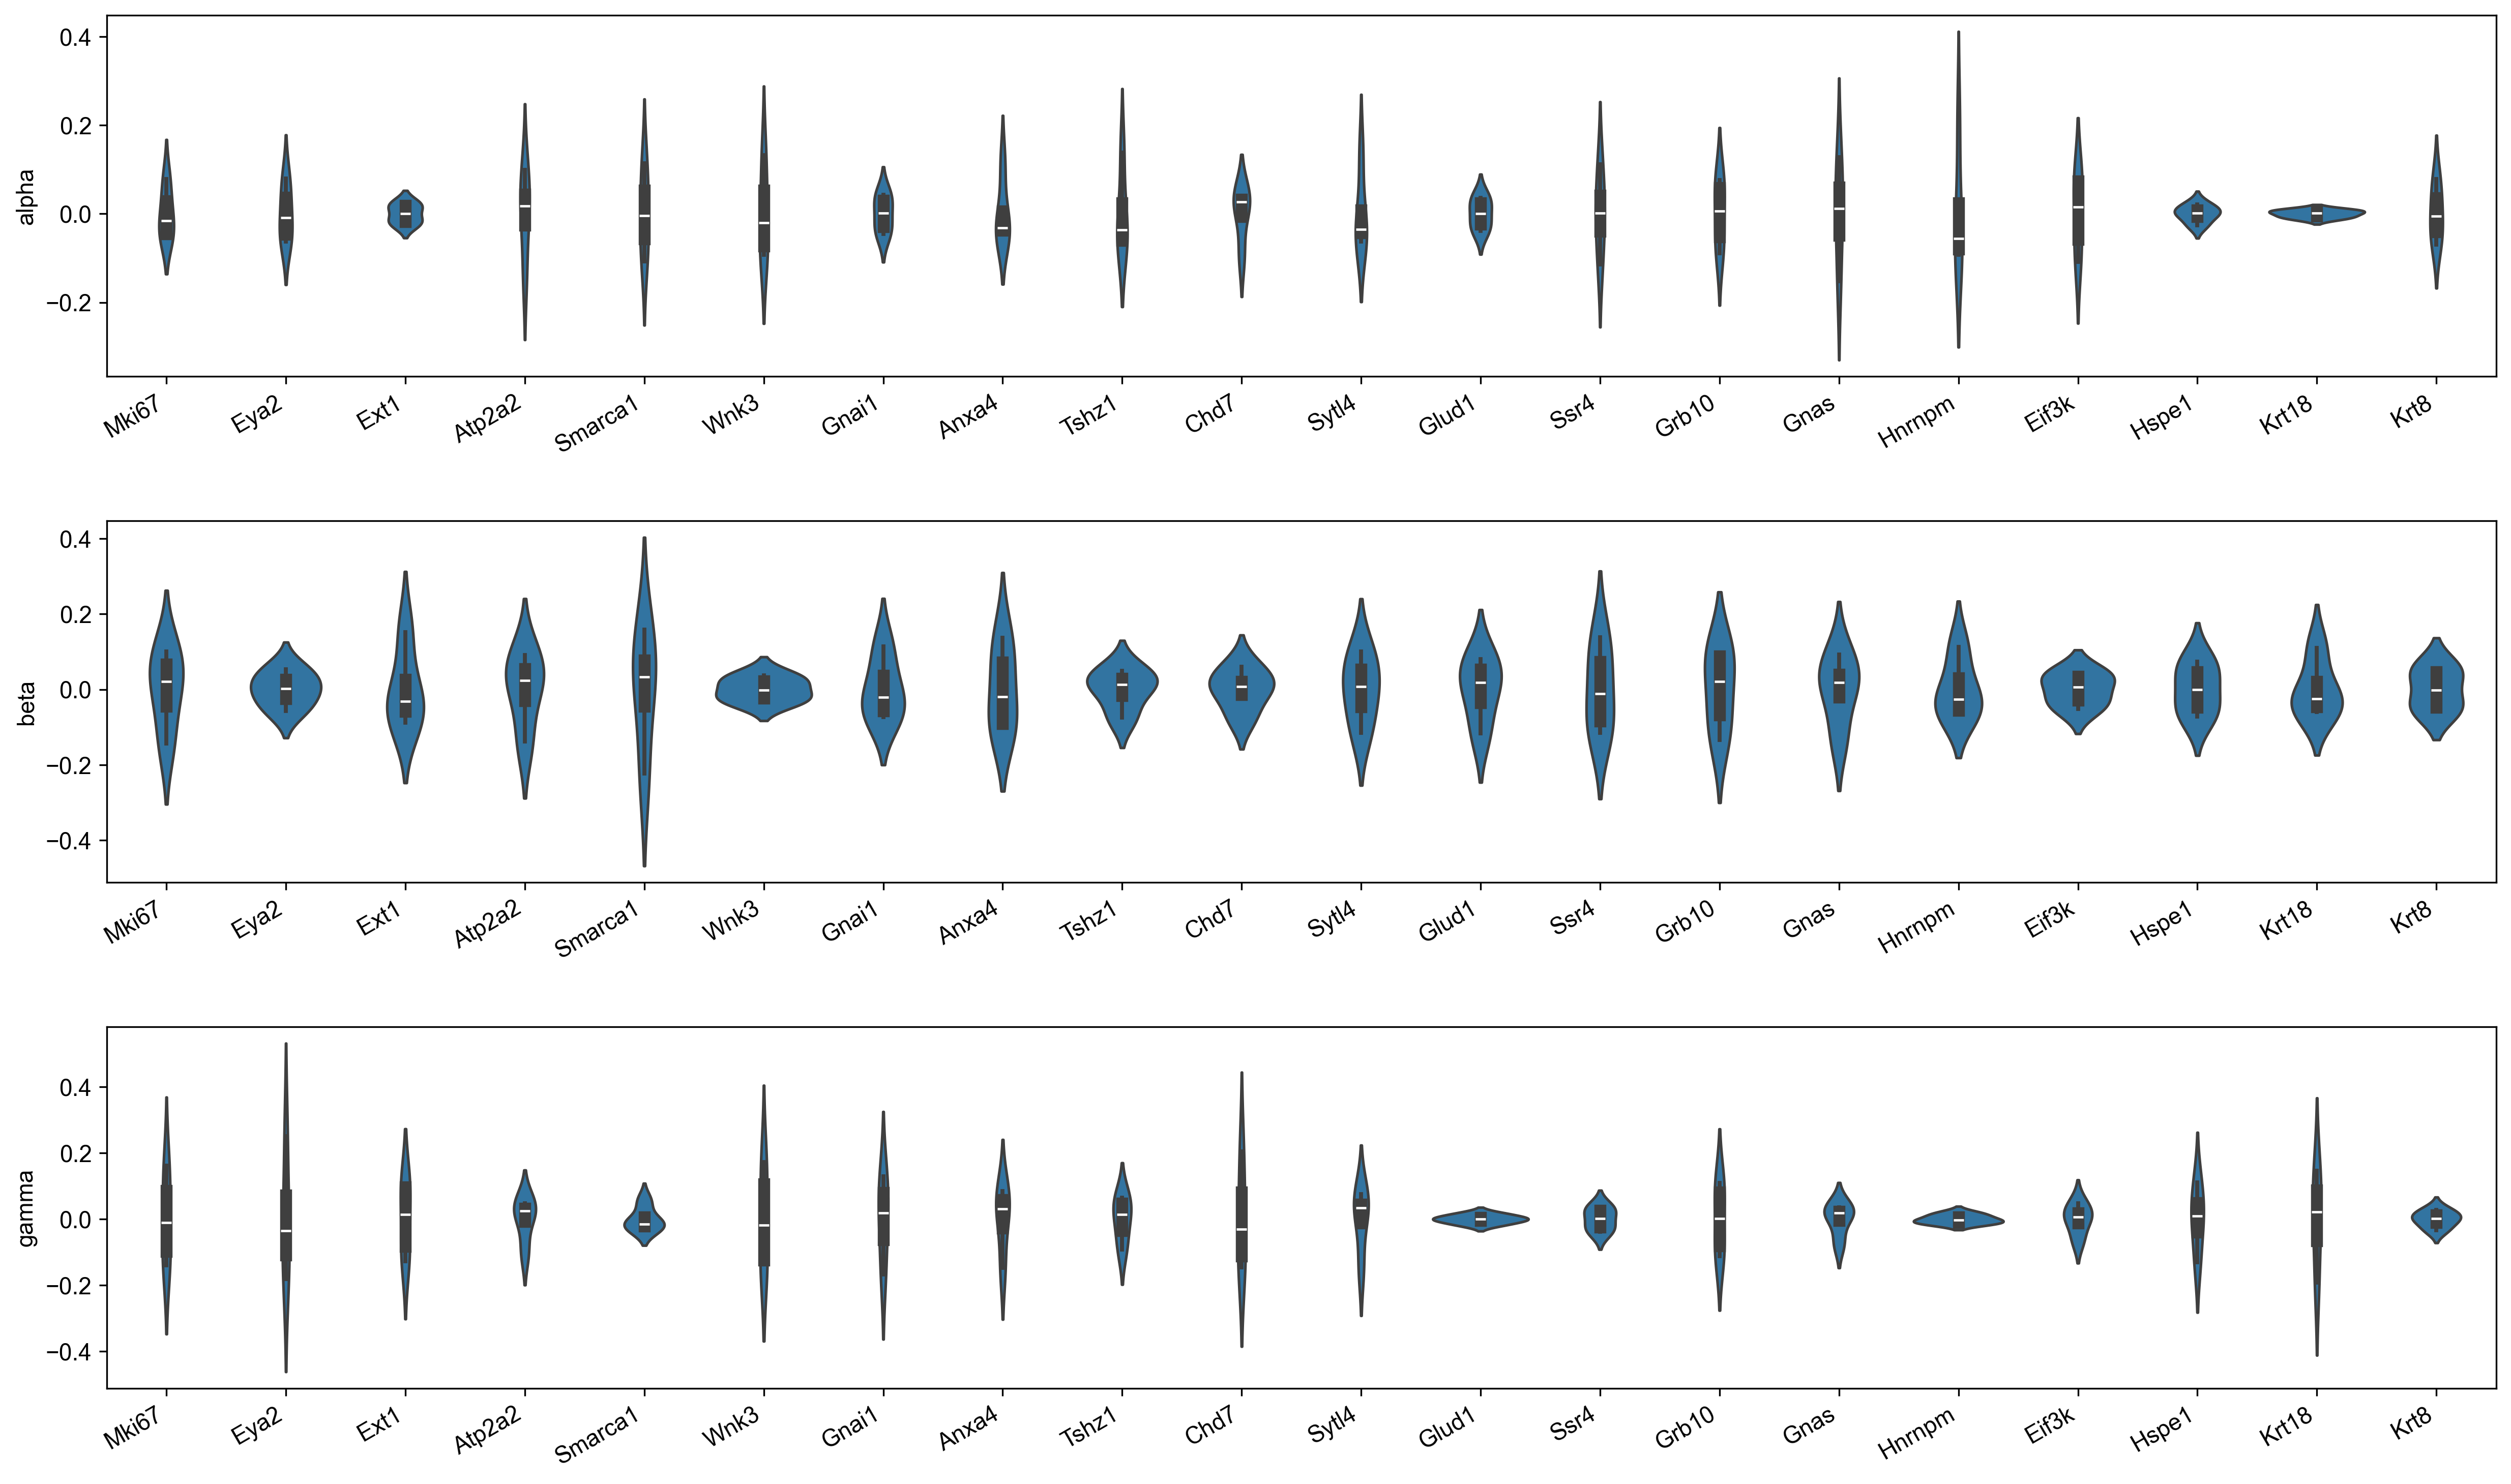
Figure 8 shows the distribution of coefficients of variation together with the mean and standard deviation (uncertainty) of the shared time for each cell. A kernel density estimate in the shared time uncertainty plot highlights the 90th percentile of the shared time standard deviation.
display(Image(filename=f"{dataset_summary.data_model_reports.path}/shared_time.pdf.png"))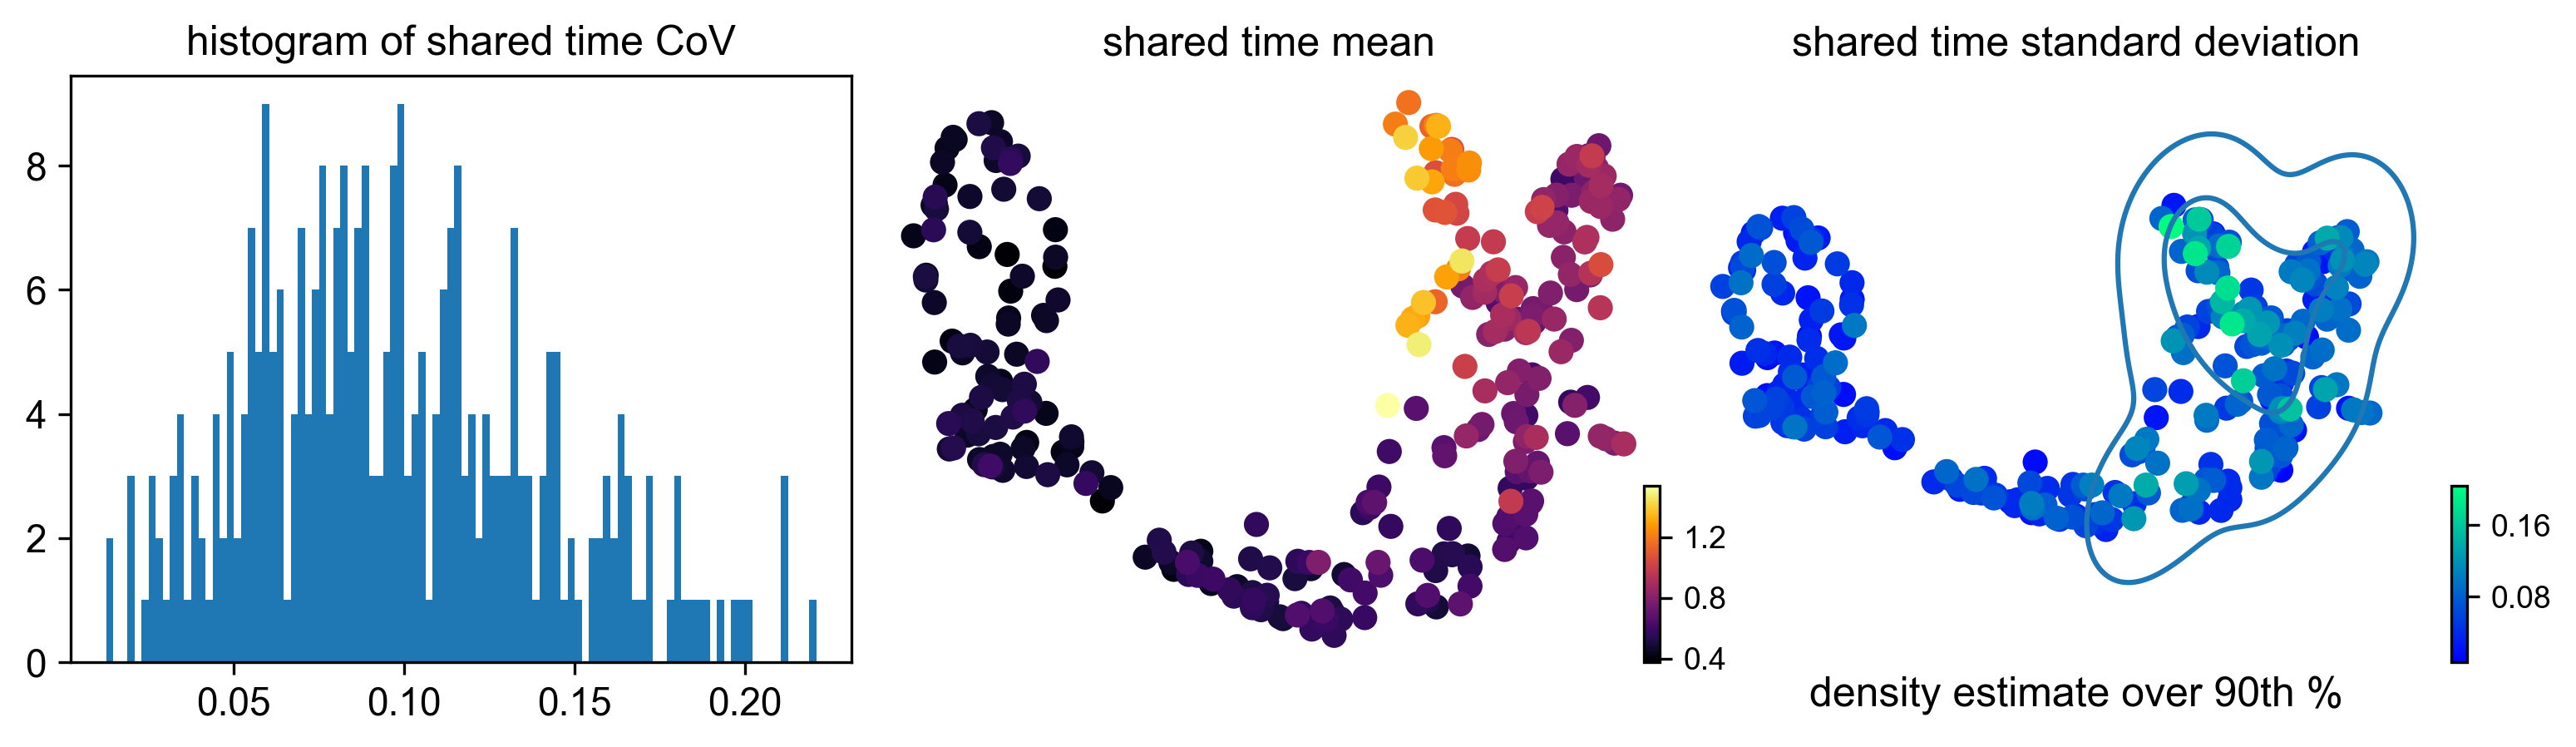
After having reviewed results that are currently computed systematically, we can also load the data and experiment.
print("This cell is intentionally left blank.") Here we will load the data and posterior samples, perform the analysis used to generate the volcano plot for gene selection, and then regenerate the plot of phase portraits, temporal evolution, and shared time correlation. It would be straightforward, and perhaps preferable in some cases, to extract all the relevant parameters from the configuration dataclass object we referenced in each section above, but we will intentionally hard-code values to be concrete. Of course, feel free to generalize these as might suit your use case.
To load the posterior samples and postprocessed data
import pyrovelocity as pv
import scanpy as sc

logger = pv.logging.configure_logging("pyrovelocity.user_notebook")

posterior_samples = pv.io.CompressedPickle.load("models/pancreas_model1/pyrovelocity.pkl.zst")
adata = sc.read("models/pancreas_model1/postprocessed.h5ad")
to generate the marker genes
volcano_data = posterior_samples["gene_ranking"]
putative_marker_genes = pv.analysis.analyze.pareto_frontier_genes(volcano_data=volcano_data, num_genes=6)
INFO pyrovelocity.analysis.analyze Found 7 genes on the current Pareto frontier: ['Hspe1', 'Hnrnpm', 'Ssr4', 'Chd7', 'Anxa4', 'Smarca1', 'Mki67'] Genes identified thus far: 7. Number of iterations: 1. Number of genes remaining: 190.
           INFO     pyrovelocity.analysis.analyze
                    Found 6 genes on the Pareto frontier for 6 requested:

                      ['Smarca1', 'Anxa4', 'Chd7', 'Ssr4', 'Hnrnpm', 'Hspe1']
In Figure 9 we show the manually generated marker gene phase portraits, temporal evolution, and shared time correlation.
with SuppressOutput():
  pv.plots.rainbowplot(
      volcano_data=volcano_data,
      adata=adata,
      posterior_samples=posterior_samples,
      genes=putative_marker_genes,
      data=["st", "ut"],
      basis="umap",
      cell_state="clusters",
  )
See Note 5 if you need to know what SuppressOutput is doing.
The best place to review the approach to generating the above plots is in the source code for the pyrovelocity.tasks.summarize module or in the docs. Additional links are shown in the help below.
pv.utils.internal_help(pv)Help on package pyrovelocity:
NAME
pyrovelocity - Pyro-Velocity
DESCRIPTION
Pyro-Velocity is a python package for probabilistic modeling of RNA velocity.
docs: https://pyrovelocity.readthedocs.io
source: https://github.com/pinellolab/pyrovelocity
PyPI package: https://pypi.org/project/pyrovelocity
Conda package: https://anaconda.org/conda-forge/pyrovelocity
discussions: https://github.com/pinellolab/pyrovelocity/discussions
issues: https://github.com/pinellolab/pyrovelocity/issues
PACKAGE CONTENTS
__main__
analysis (package)
interfaces
io (package)
logging
metrics (package)
models (package)
plots (package)
styles (package)
tasks (package)
tests (package)
utils
workflows (package)
DATA
__all__ = ['analysis', 'io', 'logging', 'metrics', 'models', 'plots', ...
VERSION
0.2.1b1
In this section we will train and show the results of an alternative model. This time we will proceed quickly through the analysis with less discussion of the various configuration settings and associated task functions.
print("This cell is intentionally left blank.") We will now use the training_configuration_2 attribute of the pancreas_configuration object to train the model.
print_config_tree(pancreas_configuration.training_configuration_2.to_dict(), "train model 2")train model 2 └── adata: data/processed/pancreas_processed.h5ad batch_size: -1 cell_specific_kinetics: null data_set_name: pancreas force: false guide_type: auto include_prior: true input_type: raw kinetics_num: 2 learning_rate: 0.01 library_size: true likelihood: Poisson log_every: 100 max_epochs: 300 model_identifier: model2 model_type: auto num_samples: 30 offset: true patient_improve: 0.0001 patient_init: 45 seed: 99 use_gpu: auto
Re-execute the train_model task function with this new configuration.
model_output_2 = train_model(
  processed_data=processed_data,
  train_model_configuration=pancreas_configuration.training_configuration_2,
)
Flyte train model input data path: /var/folders/gm/sczlkg_x4kd39019wn_f7hy80000gn/T/flyte-0fiovuo5/raw/10cb9a86b75453de16ff91278eed3ec6/pancreas_processed.h5ad
[17:58:49] INFO     pyrovelocity.tasks.train

                    Training: pancreas_model2
           INFO     pyrovelocity.tasks.train

                    Verifying existence of paths for:

                      model data: models/pancreas_model2
           INFO     pyrovelocity.tasks.train Accelerator type specified as auto resolves to:
                            accelerator: cpu
                            devices: 1
                            device: cpu
           INFO     pyrovelocity.tasks.train
                    models/pancreas_model2/trained.h5ad
                    models/pancreas_model2/model
                    models/pancreas_model2/posterior_samples.pkl.zst
                    all exist, set `force=True` to overwrite.
Flyte train model outputs:
    data model: pancreas_model2
    data model path: models/pancreas_model2
    trained data path: models/pancreas_model2/trained.h5ad
    model path: models/pancreas_model2/model
    posterior samples path: models/pancreas_model2/posterior_samples.pkl.zst
    metrics path: models/pancreas_model2/metrics.json
    run info path: models/pancreas_model2/run_info.json
    loss plot path: models/pancreas_model2/ELBO.png
This produces the model_output_2.
print_config_tree(model_output_2.to_dict(), "model output 2")model output 2 └── data_model: pancreas_model2 data_model_path: models/pancreas_model2 loss_plot_path: path: /var/folders/gm/sczlkg_x4kd39019wn_f7hy80000gn/T/flyte-0fiovuo5/raw/53e7a6f7ae760eed0977854a86160056/ELBO.png metrics_path: path: /var/folders/gm/sczlkg_x4kd39019wn_f7hy80000gn/T/flyte-0fiovuo5/raw/0c6fd5b17fac1b21b9768e405e81cb85/metrics.json model_path: path: models/pancreas_model2/model posterior_samples_path: path: /var/folders/gm/sczlkg_x4kd39019wn_f7hy80000gn/T/flyte-0fiovuo5/raw/340564333f5df90974b2b4b8c14d2c2c/posterior_samples.pkl.zst run_info_path: path: /var/folders/gm/sczlkg_x4kd39019wn_f7hy80000gn/T/flyte-0fiovuo5/raw/fe05d8e39acbeeb4971f64643e586849/run_info.json trained_data_path: path: /var/folders/gm/sczlkg_x4kd39019wn_f7hy80000gn/T/flyte-0fiovuo5/raw/f8f57d6195d1ac61984d96d74f08e684/trained.h5ad
The postprocess data task is executed with the postprocess_data function.
from pyrovelocity.utils import SuppressOutput

with SuppressOutput():
  postprocessing_outputs_2 = postprocess_data(
    preprocess_data_args=pancreas_configuration.preprocess_data,
    training_outputs=model_output_2,
    postprocess_configuration=pancreas_configuration.postprocess_configuration,
)Now we have what is required to construct a summary of the results.
dataset_summary_2 = summarize_data(
  preprocess_data_args=pancreas_configuration.preprocess_data,
  postprocessing_outputs=postprocessing_outputs_2,
  training_outputs=model_output_2,
)
The dataset summary contains
print_config_tree(dataset_summary_2.to_dict(), "dataset summary")dataset summary └── data_model_reports: path: reports/pancreas_model2 dataframe: path: /var/folders/gm/sczlkg_x4kd39019wn_f7hy80000gn/T/flyte-0fiovuo5/raw/88afb2a26a92e597d27e32373fa05986/pancreas_model2_dataframe.pkl.zst
A vector field estimate of cell state transformation probability derived from RNA velocity estimates with cluster annotations is shown in Figure 10.
display(Image(filename=f"{dataset_summary_2.data_model_reports.path}/vector_field.pdf.png"))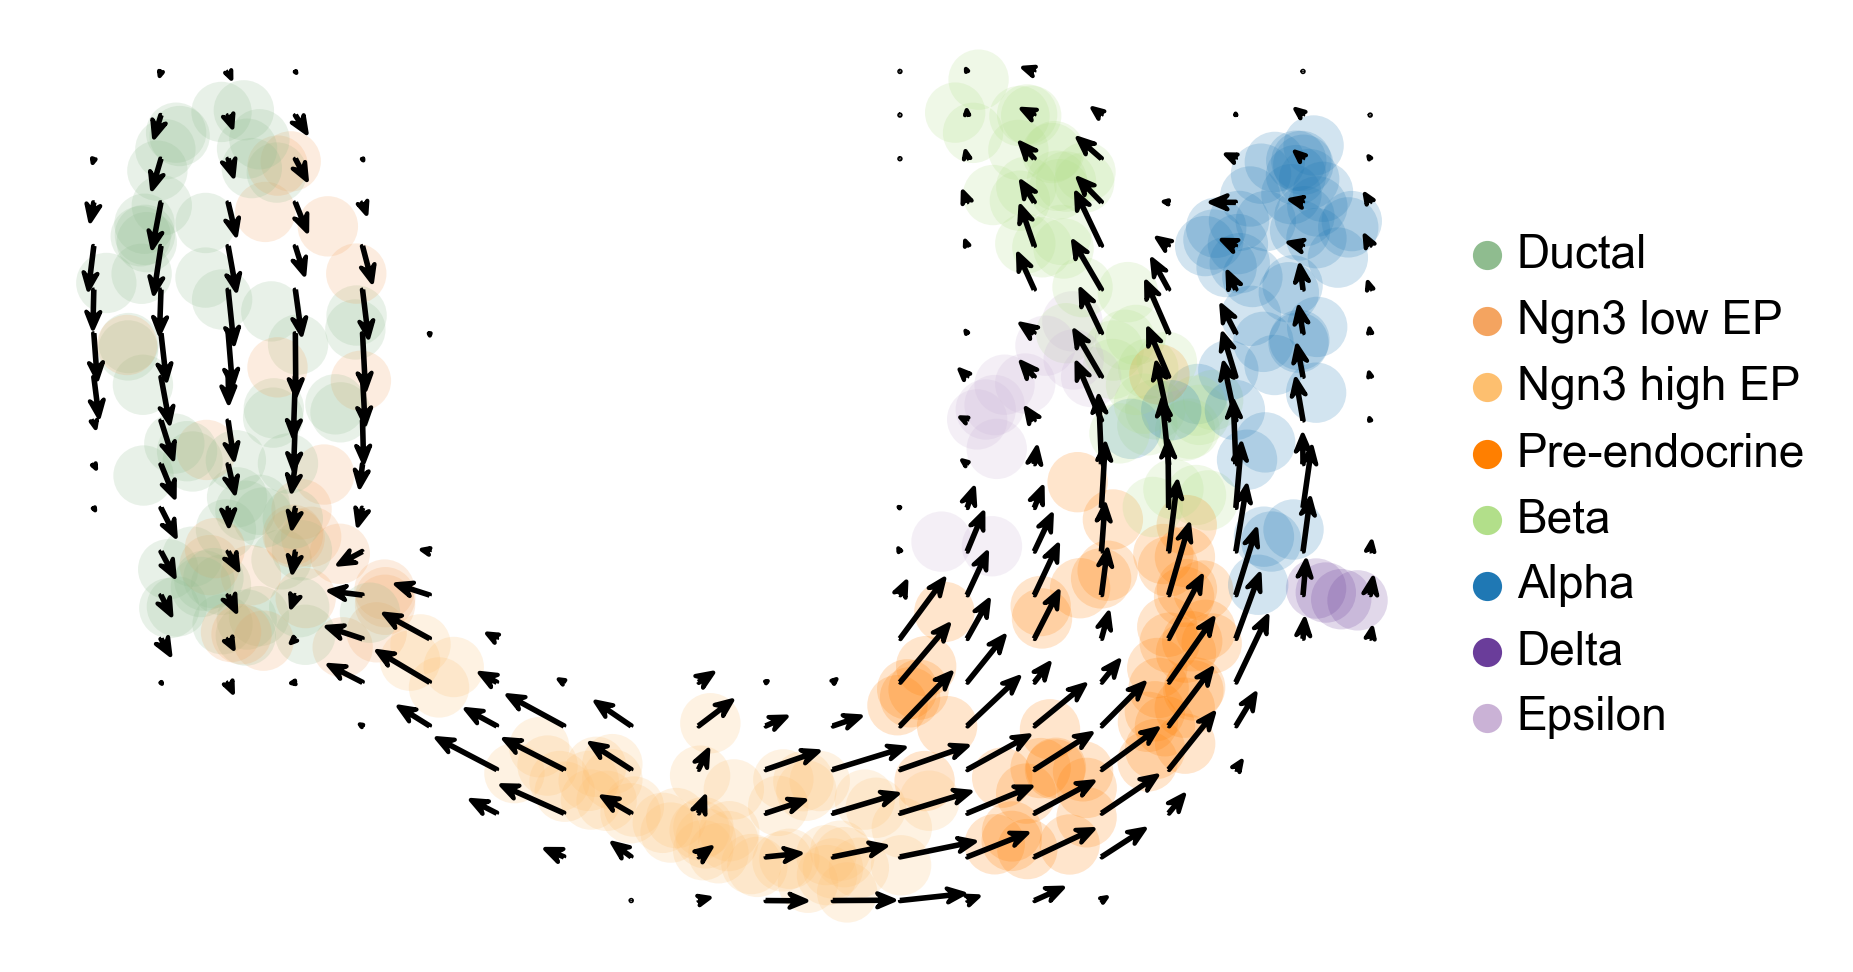
Figure 11 shows a low-dimensional representation of the RNA velocity vector fields with uncertainty estimates for shared time and angle. The latter quantity is estimated in PCA space. The base magnitude uncertainty is also shown but may not be interpretable.
display(Image(filename=f"{dataset_summary_2.data_model_reports.path}/vector_field_summary_plot.pdf.png"))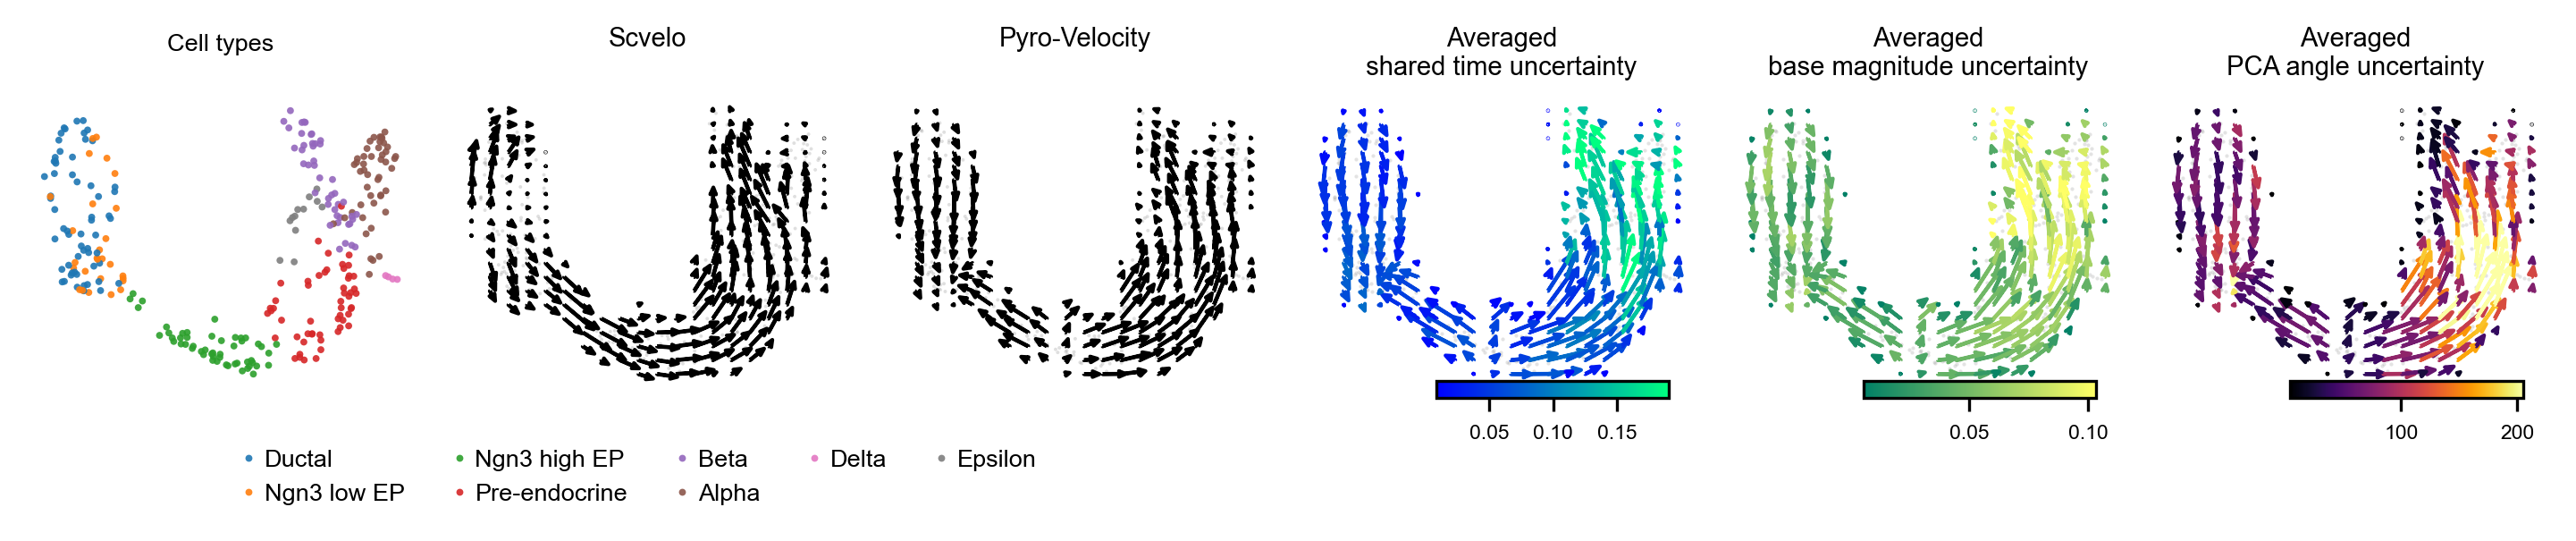
A volcano plot adapted for probabilistic inference of RNA velocity is shown in Figure 12. This plot shows the mean absolute error versus shared time correlation for each gene.
display(Image(filename=f"{dataset_summary_2.data_model_reports.path}/volcano.pdf.png"))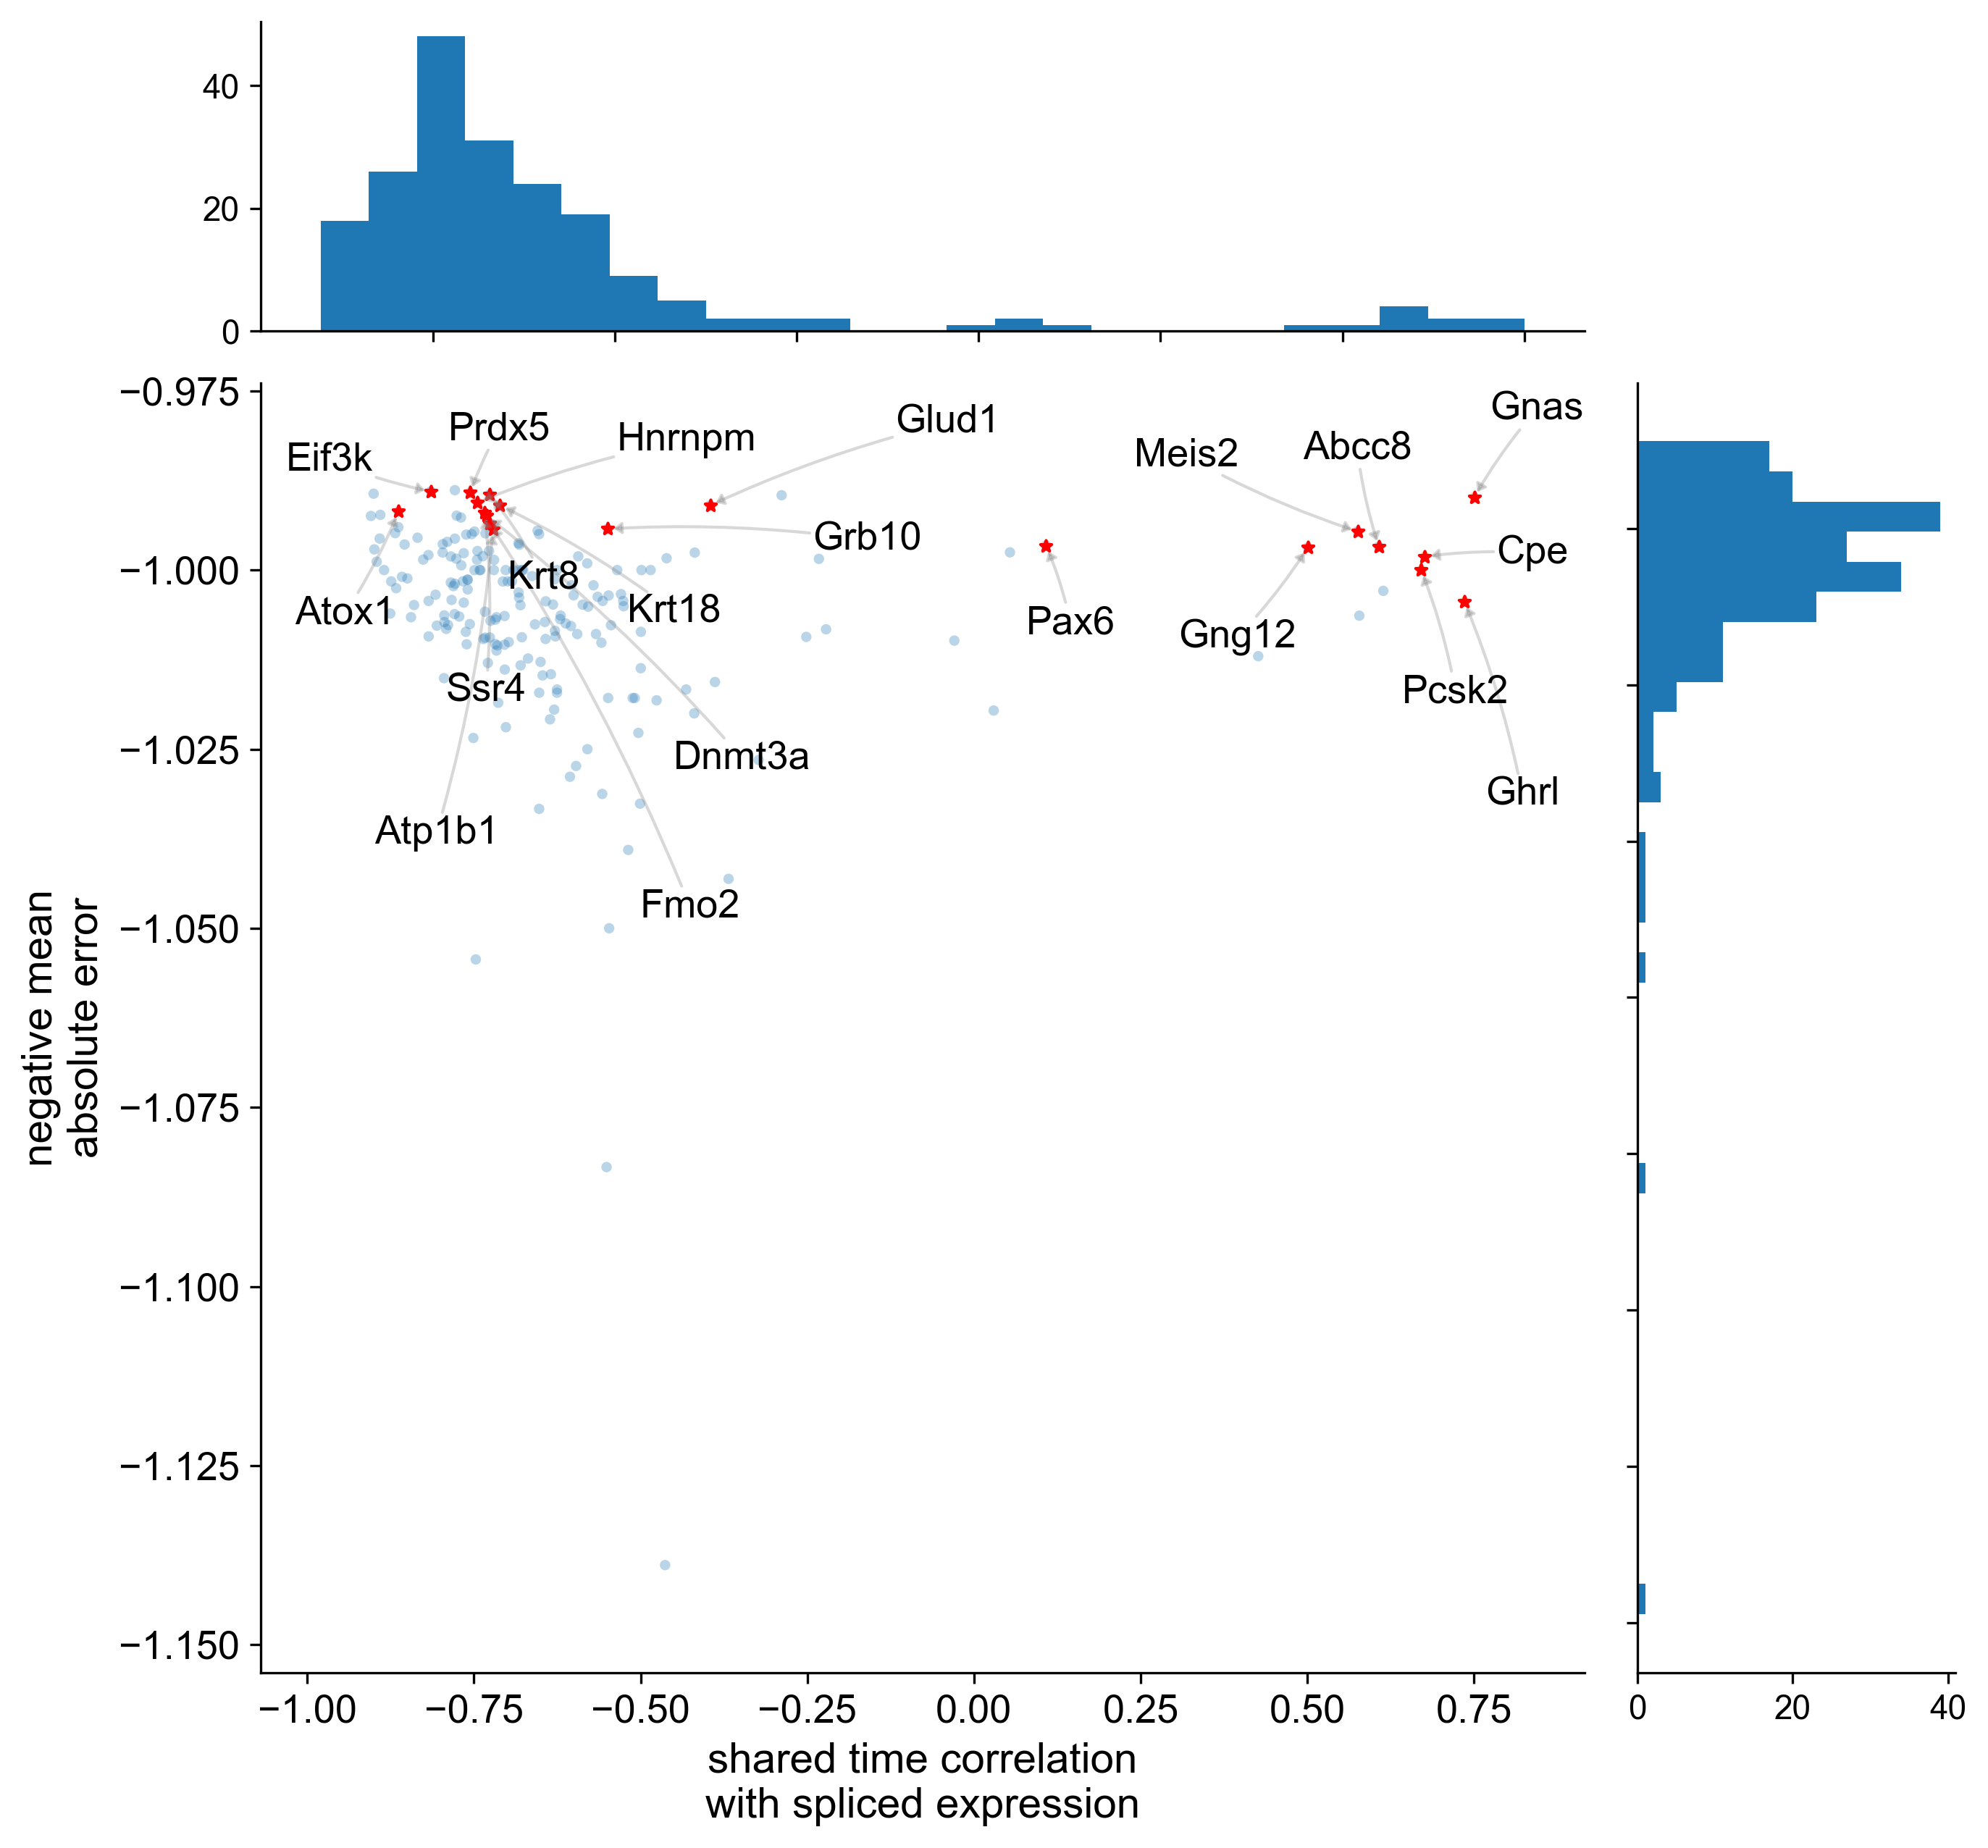
Figure 13 shows the splice state phase portraits, estimated expression levels over shared time, and shared time correlation for a subset of selected genes.
display(Image(filename=f"{dataset_summary_2.data_model_reports.path}/gene_selection_rainbow_plot.pdf.png"))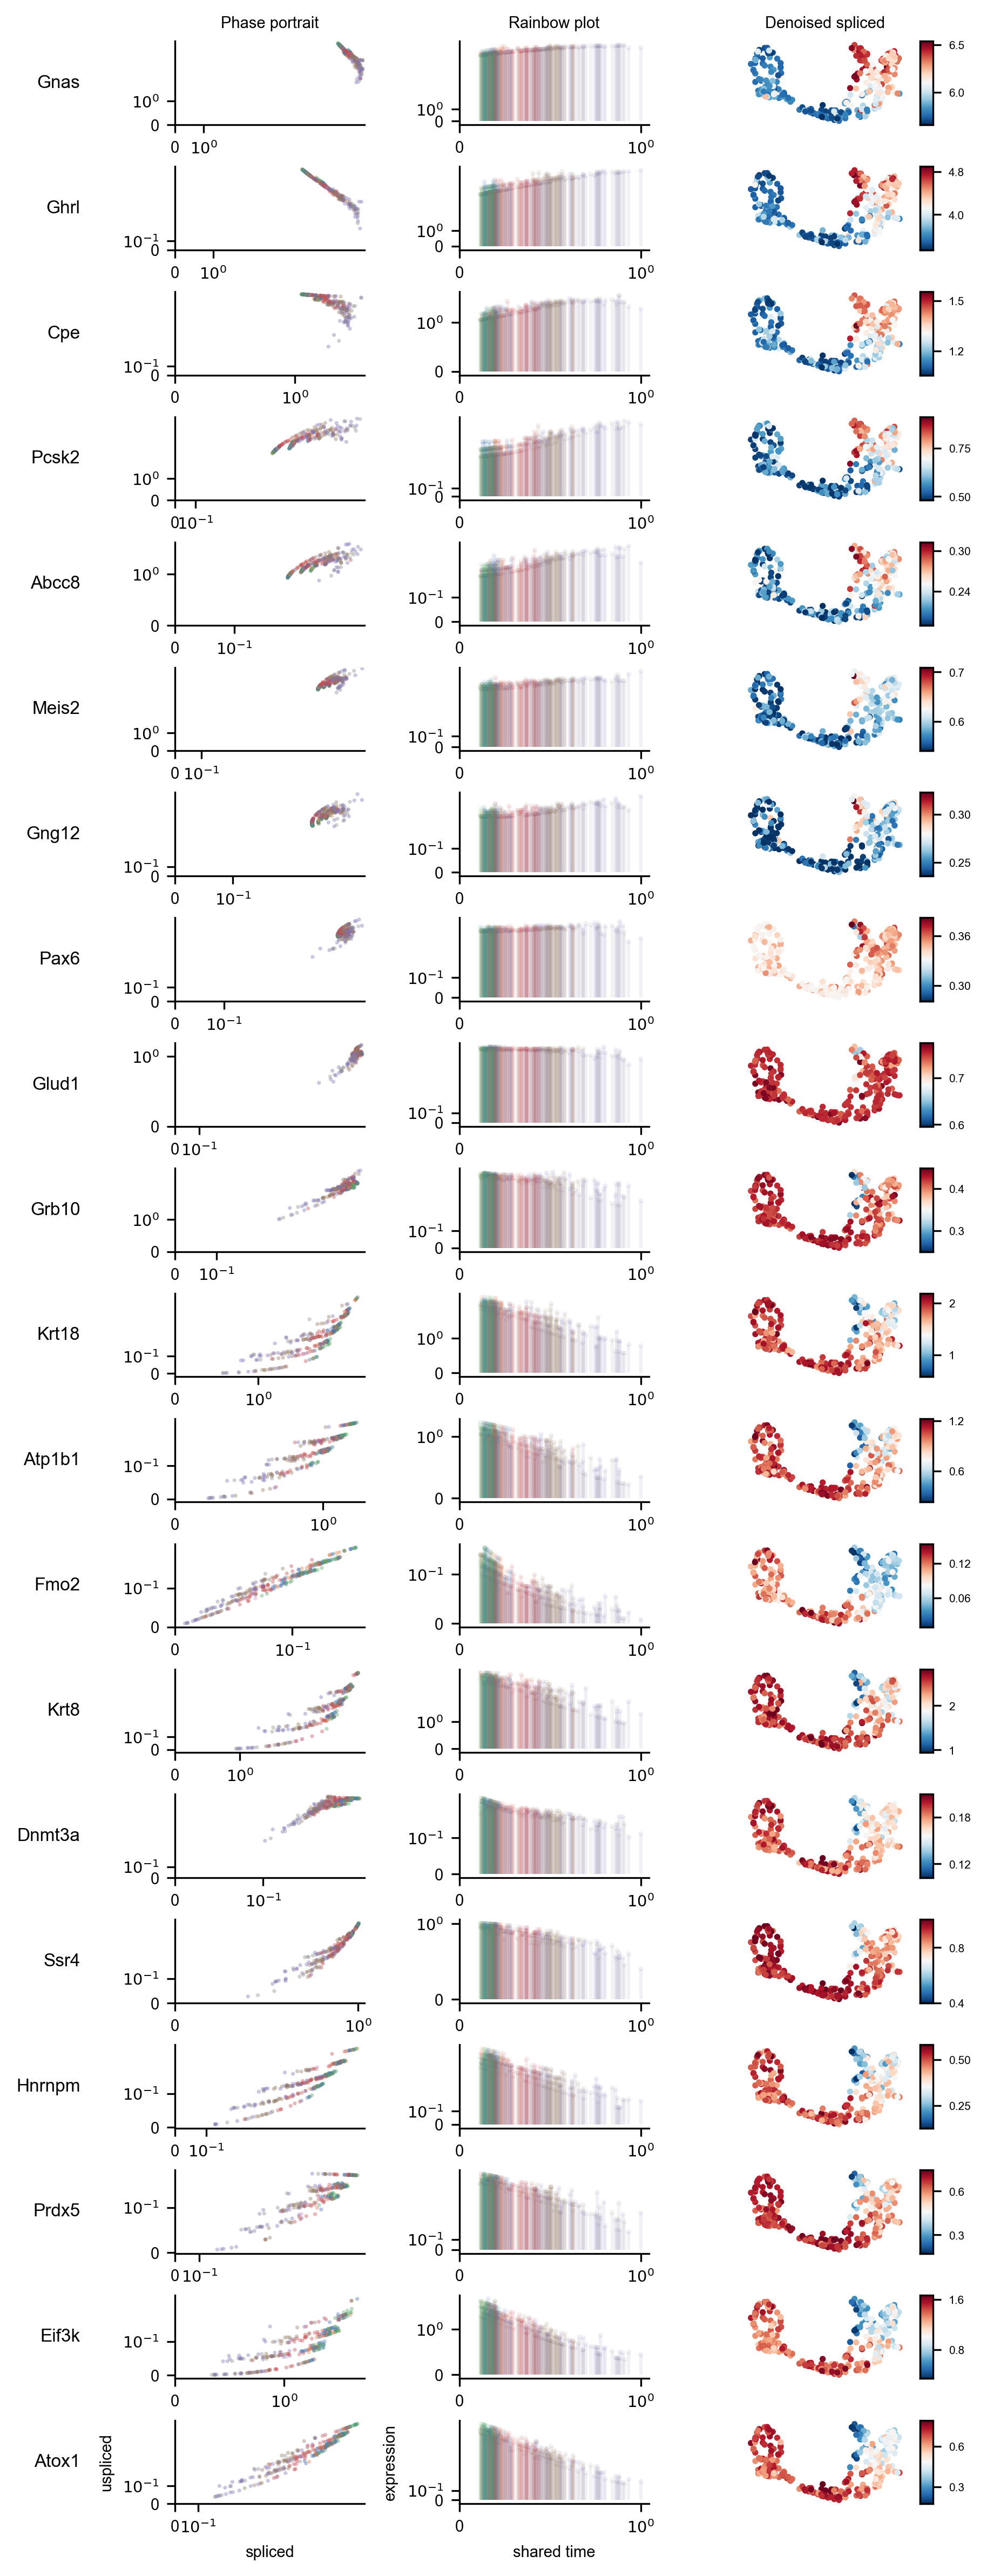
A summary of the gene selection results is shown in Figure 14.
display(Image(filename=f"{dataset_summary_2.data_model_reports.path}/gene_selection_summary_plot.pdf.png"))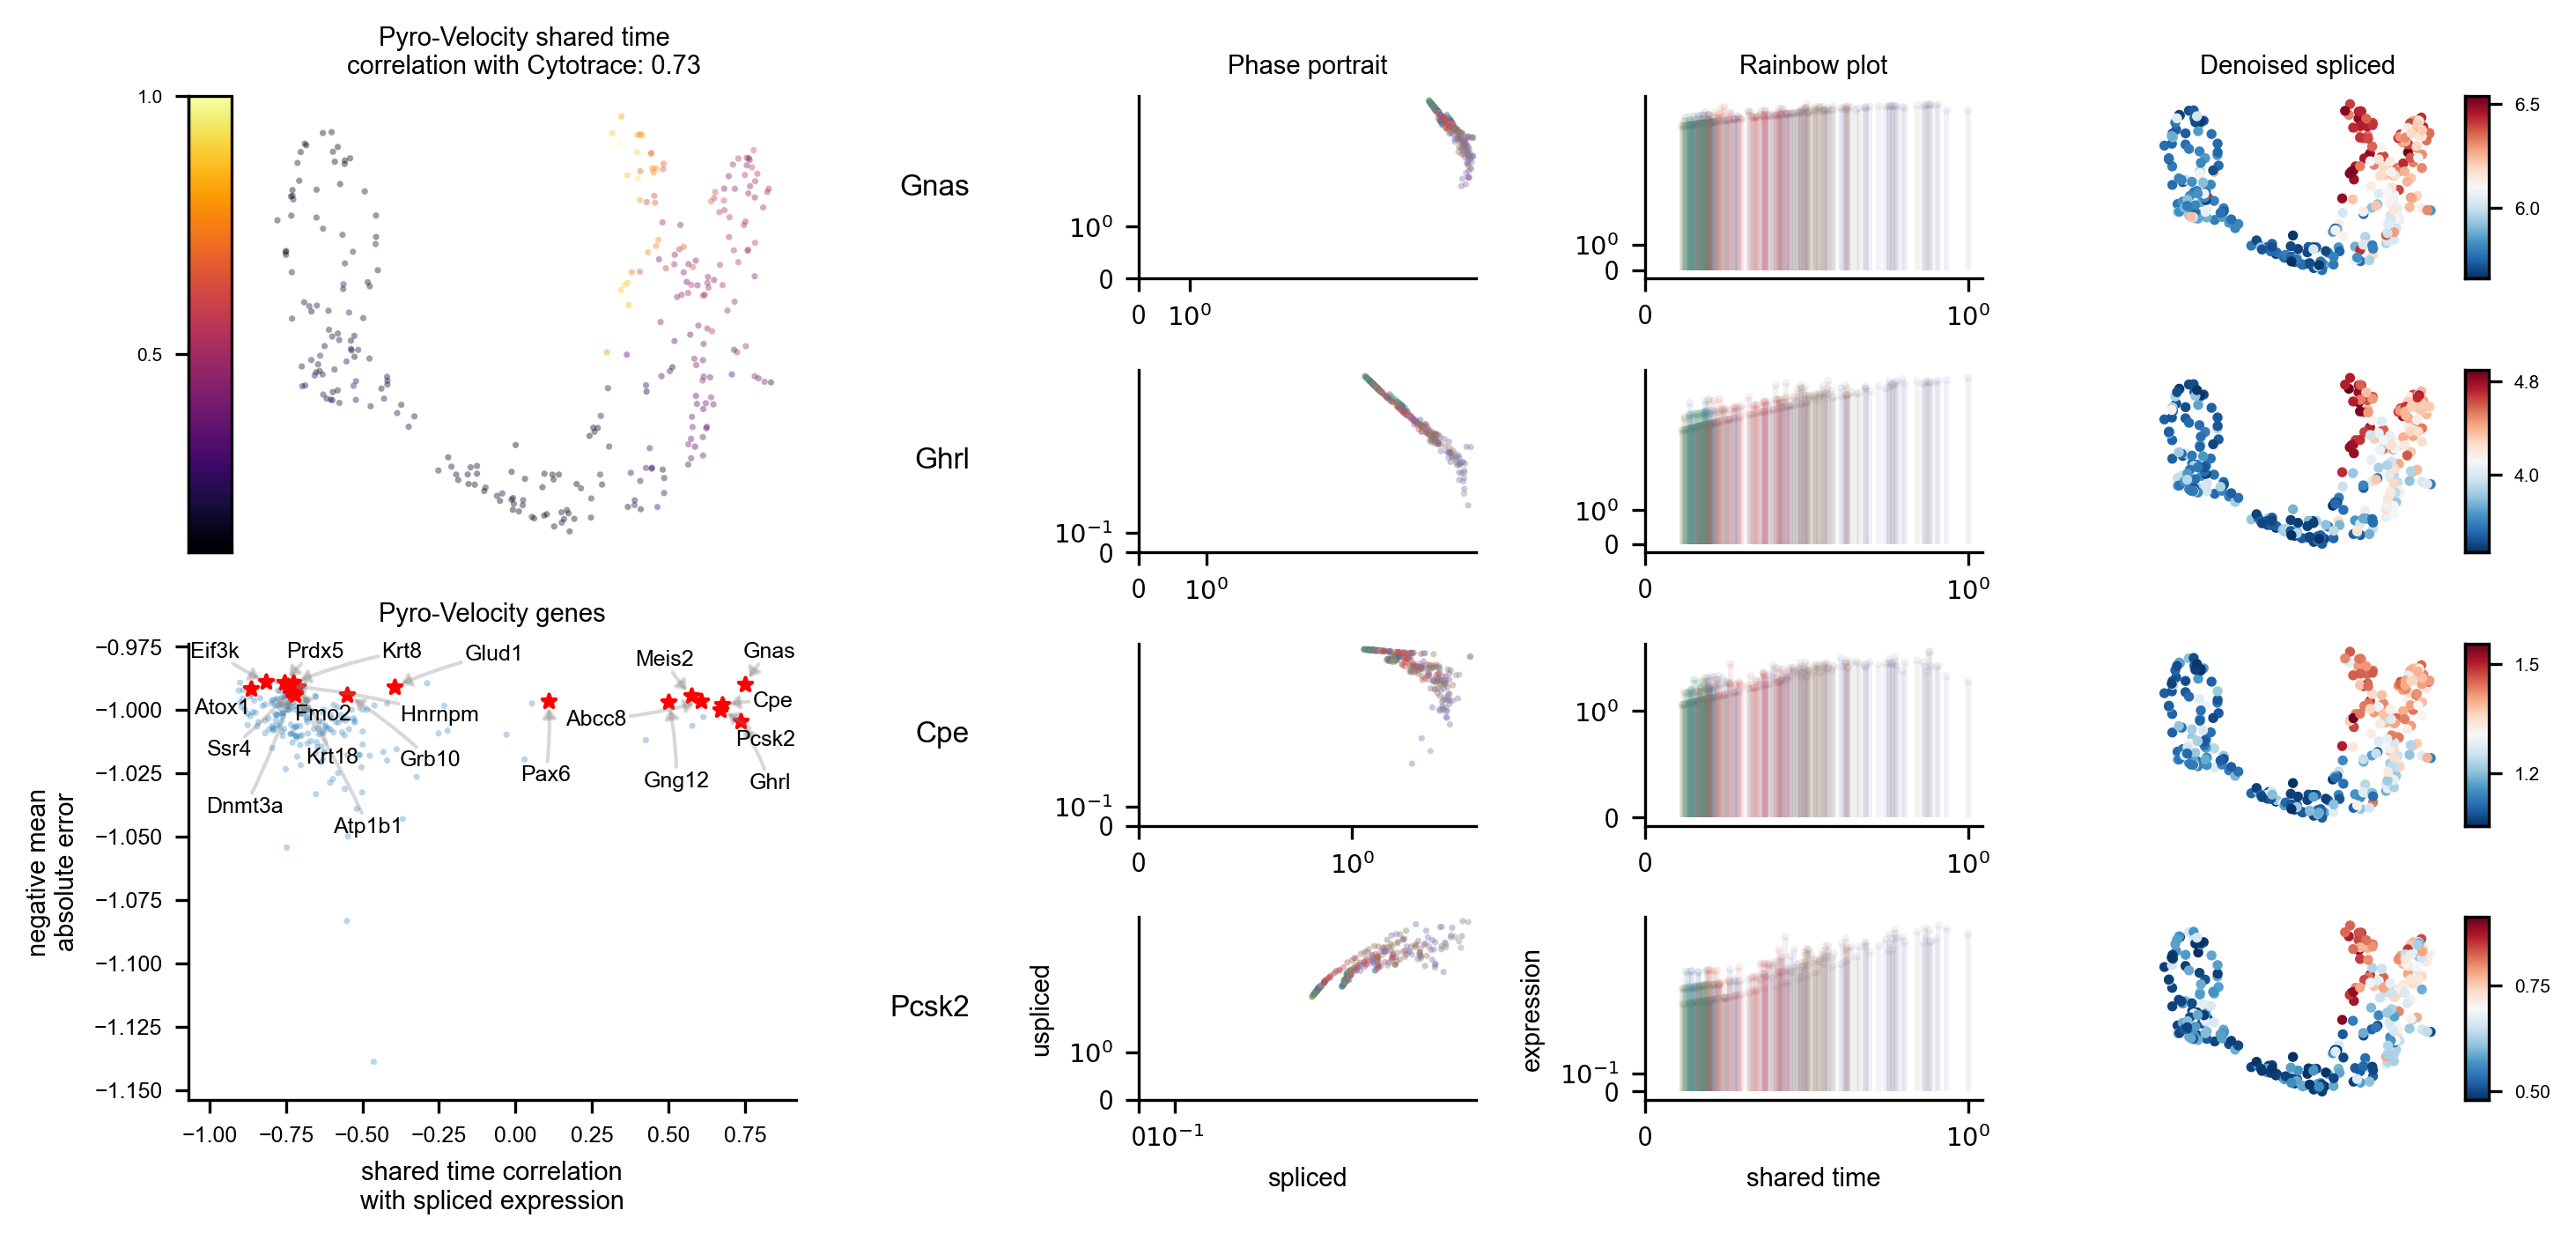
Estimates for parameter uncertainties for a subset of genes are shown in Figure 15.
display(Image(filename=f"{dataset_summary_2.data_model_reports.path}/parameter_uncertainties.pdf.png"))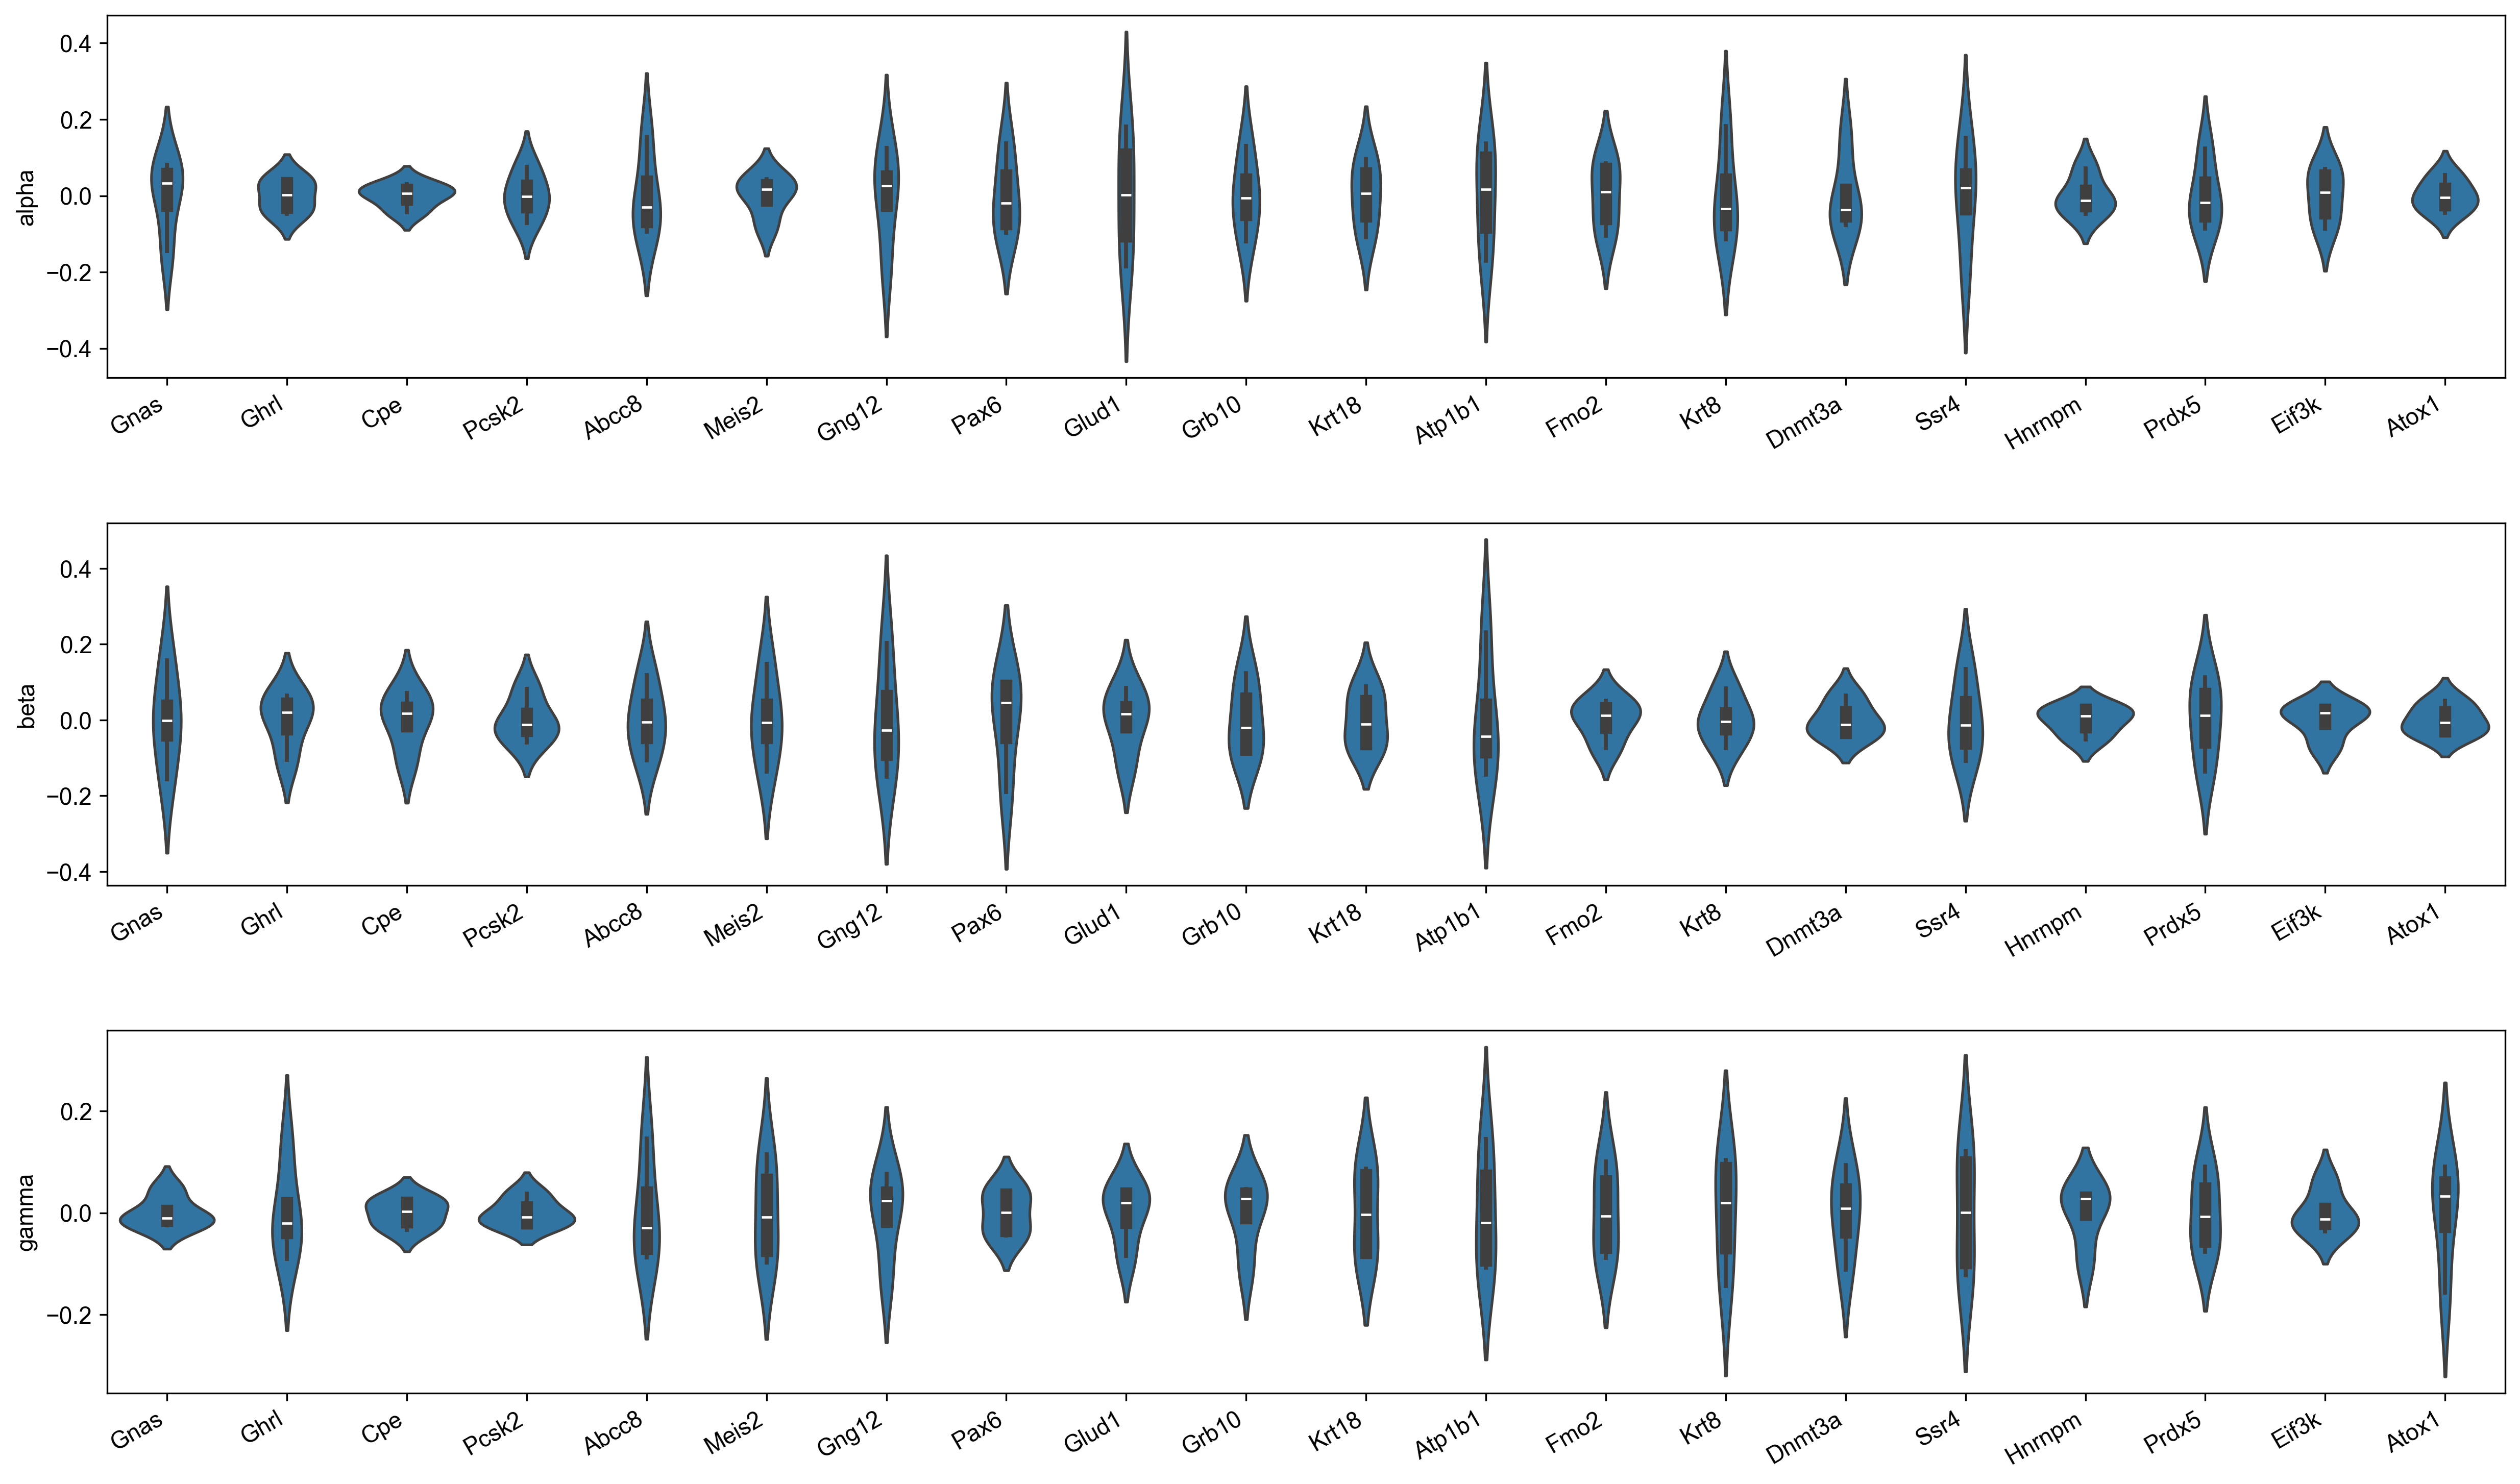
Figure 16 shows the distribution of coefficients of variation together with the mean and standard deviation (uncertainty) of the shared time for each cell. A kernel density estimate in the shared time uncertainty plot highlights the 90th percentile of the shared time standard deviation.
display(Image(filename=f"{dataset_summary_2.data_model_reports.path}/shared_time.pdf.png"))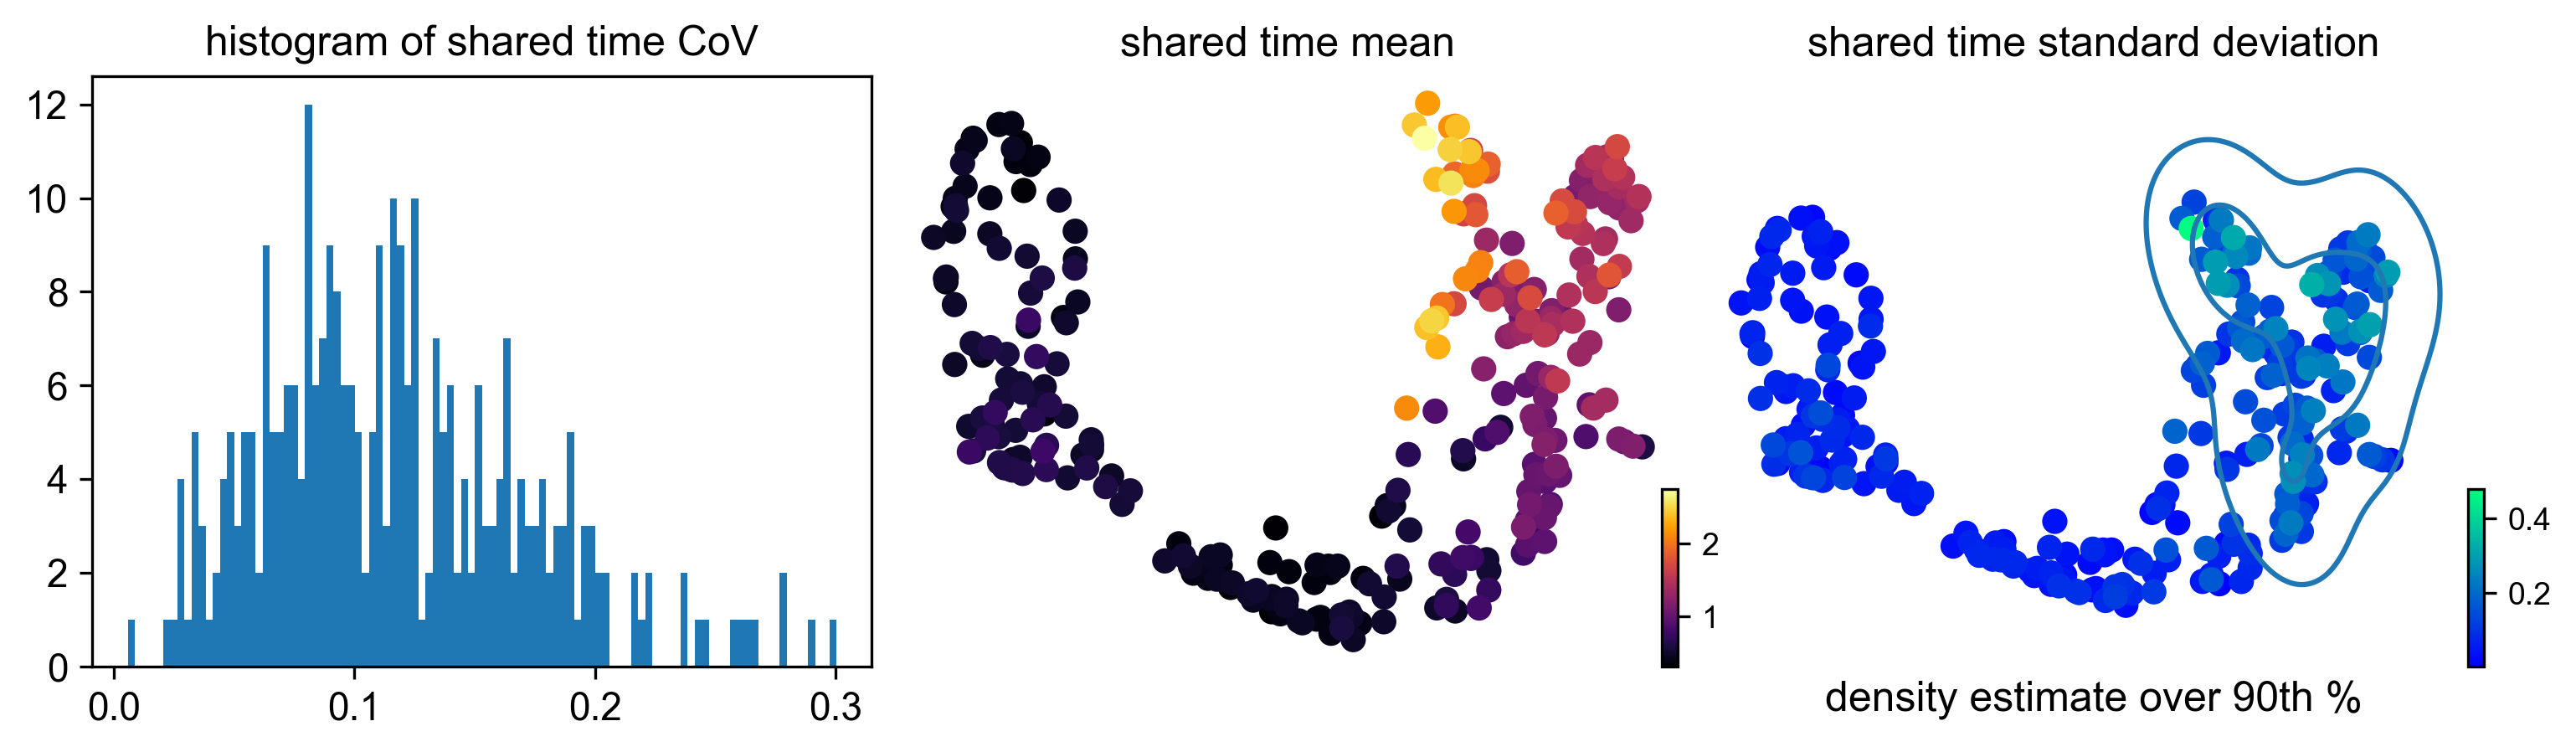
In this notebook we have demonstrated how to install pyrovelocity and execute a comprehensive workflow to perform a probabilistic analysis of RNA velocity for a single-cell transcriptomics data set in a Jupyter notebook. We default to data downsampled in this case by about a factor of 10 to allow for swift execution to illustrate the analysis workflow. In particular, we have shown how to download data, preprocess it, train a model, postprocess the results, and summarize the data with a compendium of plots. We have also shown how to experiment with the data and posterior samples to generate new plots, and how to train, postprocess, and summarize the results for an alternative model. This information should be sufficient to see how to get started applying pyrovelocity to your own data. We will discuss approaches to model comparison, criticism, and selection in a separate notebook. Please do not hesitate to reach out in the discussions board on github if you run into any problems using the library.
See